A long XSLT transformation runtime multiplied with an high amount of requested assets (via LiveQuerys) can have a massive performance impact for users in censhare Web which can result in slow loading of Widget content.
To find out if (customized) XSLT transformations must be optimized we need to activate additional logging to get the runtime as well as the resource key of the executed XSLT transformation.
The additional load of logging to level FINE for a single class is negligible. It can be (de)activated during runtime. However a permanent logging to level FINE is not recommended.
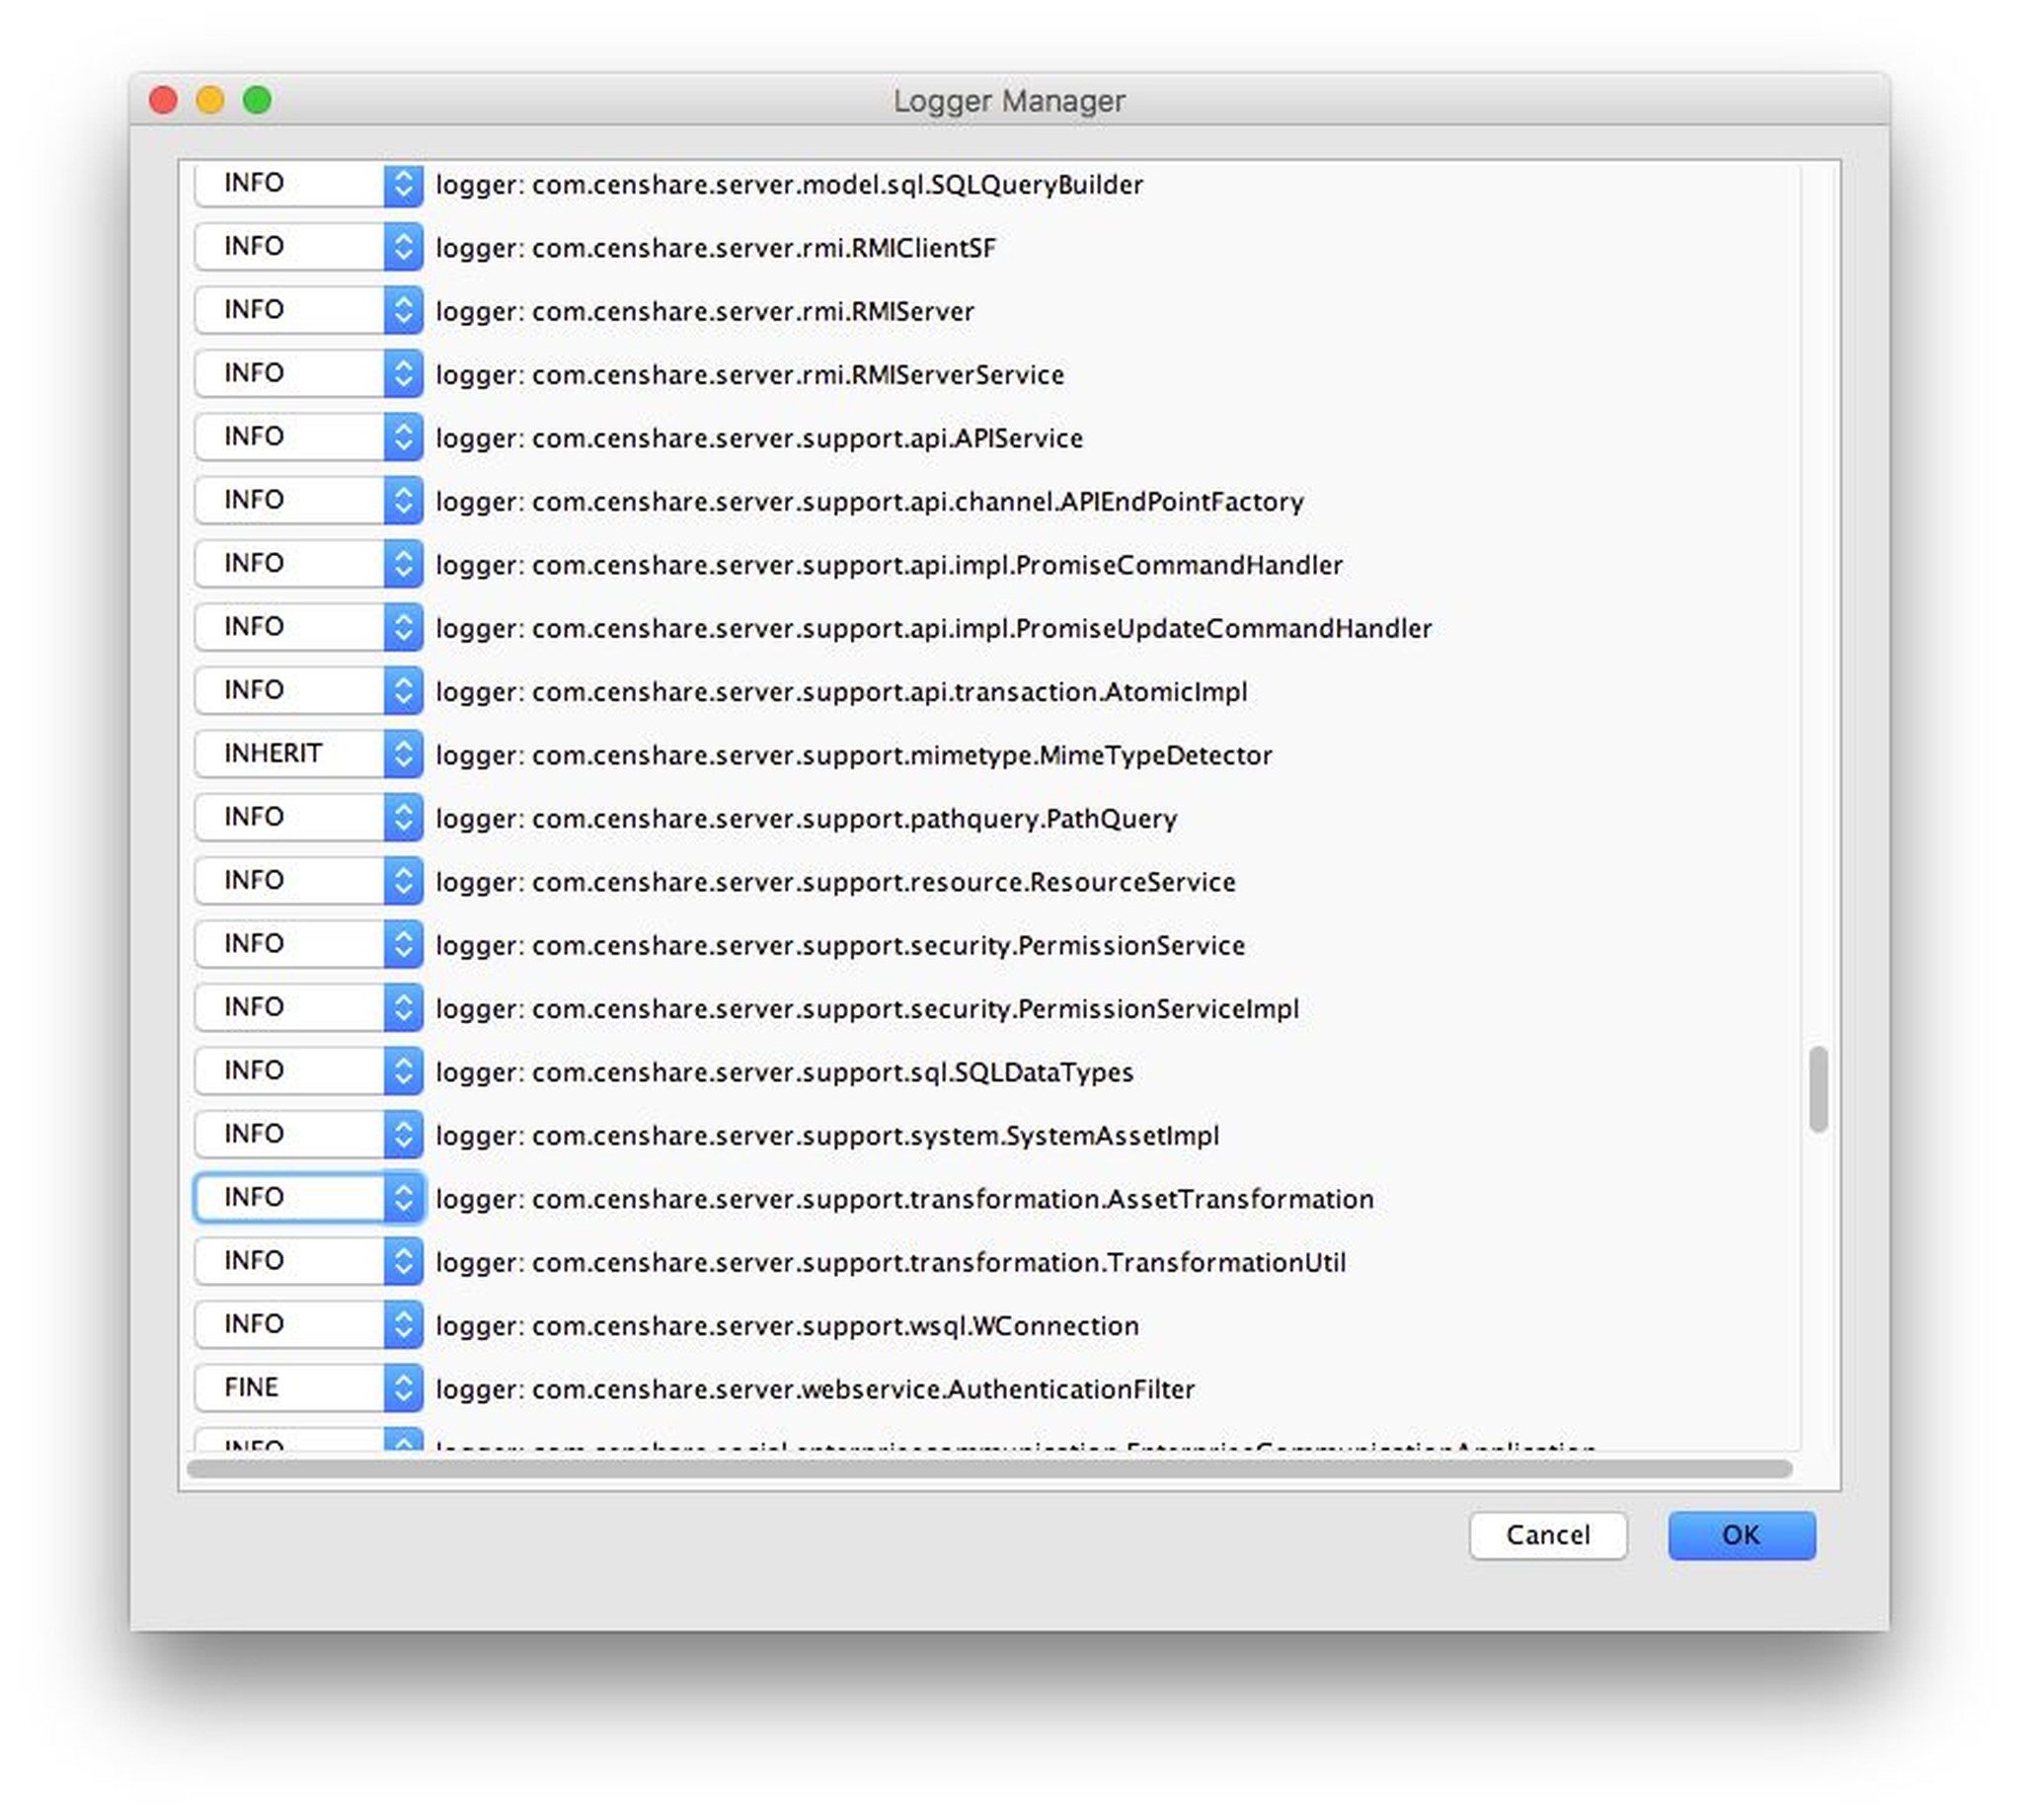
Execute Server Action Logger Manager (censhare-Admin) and change "com.censhare.server.support.transformation.AssetTransformation" from log level "INFO" to "FINE"
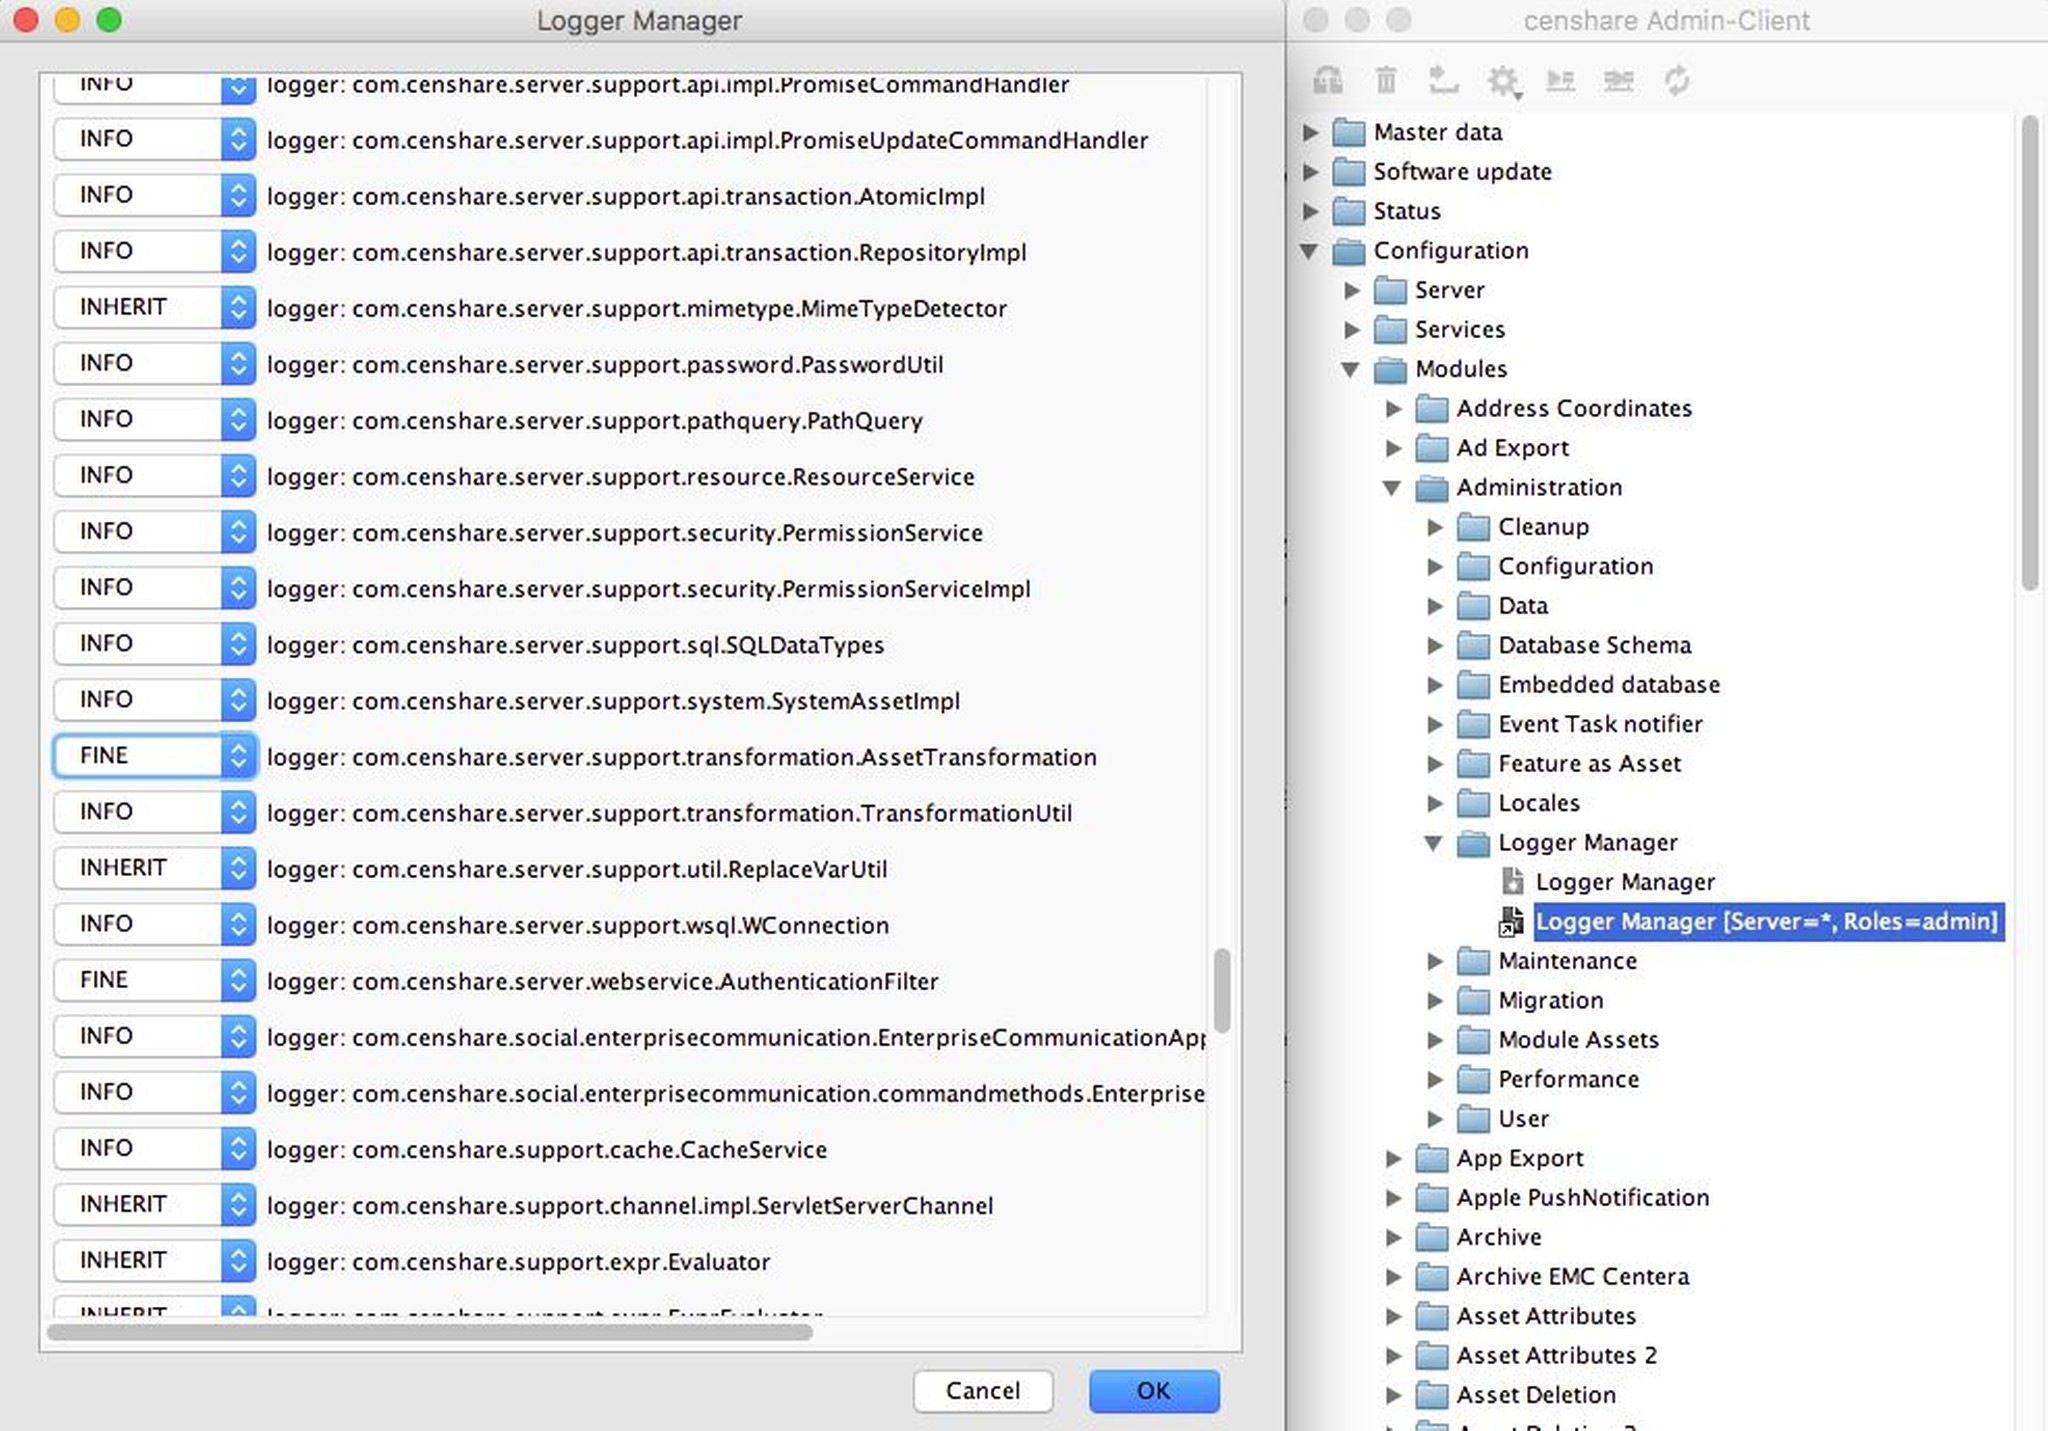
The Server Action Logger Manager is not activated per default. It needs a configuration refresh. Then it can be found under the gear symbol.
It shows the execution time (done in ms) for the XSLTs now.
grep "AssetTransformation.*done in" ~/work/logs/server-0.?.log
CODE
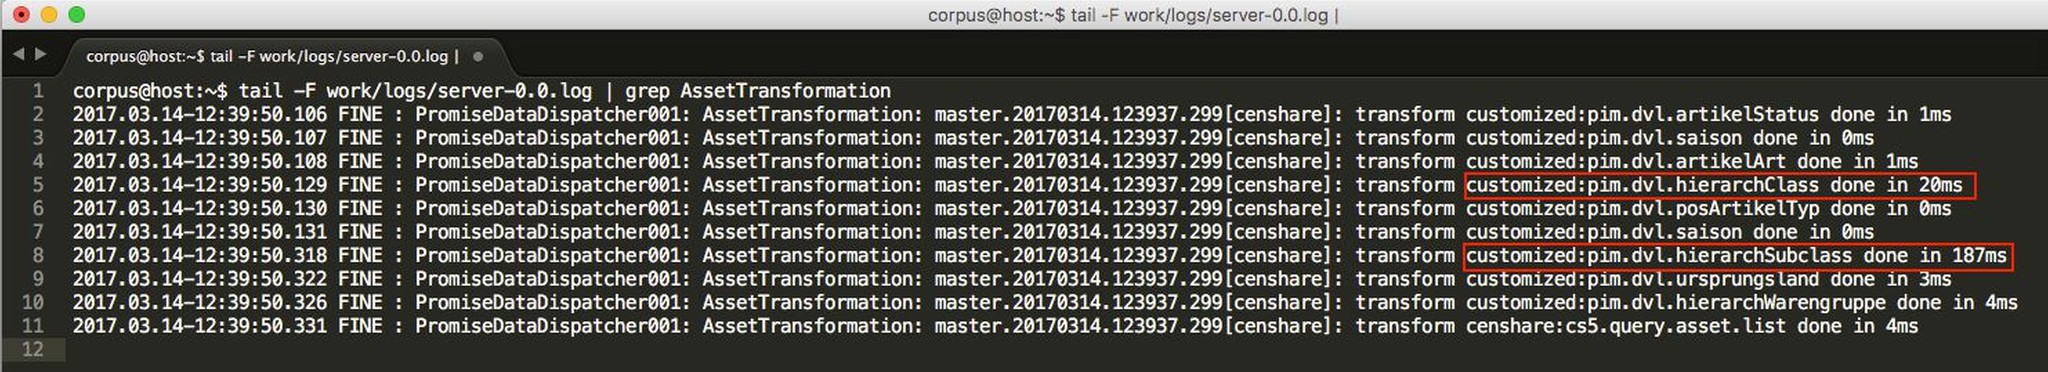
server-0.0.log: Here's an example of an Asset from a query result
This means that customized:pim.dvl.hierarchClass and customized:hierarchSubclass have together a runtime higher than 200ms per asset! The rest is below 10ms and this is ok.
Now it is worth it to check these both customized transformations more in detail regarding inefficient programming (e.g. multiple searching through lists of several thousand entries, unnecessary xmlns attributes, etc).
As permanent logging to level FINE is not recommended, we should deactivate it.
Execute Server Action Logger Manager (censhare-Admin) and change "com.censhare.server.support.transformation.AssetTransformation" from log level "FINE" to "INFO"