Know how to Analyse Database Connections in censhare
Configuration Experiences
How much (maximal open) database connections should be configured?
It depends on ...
on the number of concurrent users (not every user opens a database connection)
on the number of active threads (kind of how and which censhare modules are configured)
on the number of remote servers connected (only those which tunneling the database connection through RMI)
on the number of configured invocations in DataObjectService.
In general, you can calculate a number of 50 maximum open database connections per application server by rule of thumb. Example: Everyone of 4 node application servers should have a value of 50 maximum open database connections configured.
Since Versions 2017.2.0 and higher the default maximum open database connections per application server were increased from 50 to 150. This was necessary as more and more resources will be used by the censhare Server (e.g. censhare Web, CDB) instead of the resources of the Backend Database System (e.g. Oracle/PostgreSQL).
Now, if a remote server doesn't have a direct JDBC database connection and requests it indirectly over RMI from another (mostly the master) server, then the master server needs +50 open database connections, i.e. whose value increases to a maximum of 100 open database connections.
With this info you could determine the values for your environment by a rule of thumb.
Don't forget that the increase of the value may need to increase the JVM heap size as well, because JDBC database connections costs heap memory (a few MB) as well.
Furthermore, it is to know that the value is only a soft limit. The real limit of database connections is set by the Oracle parameter processes, respectively its RAM (sga size) allocation. Note that Oracle's default value of 150 processes is sufficient for two censhare servers, but we change it in our DBCA template to 300 processes. We never change the 'sessions' parameter on Oracle, because it's default value is OK = (1.1 * PROCESSES) + 5.
The value of processes parameter in Oracle should be set to the result of the following formula:
"processes parameter" > ( "censhare max open JDBC connections" * "number of censhare servers") + "number of oracle background processes"
Example for 4 censhare servers: 300 > ( 50 * 4 ) + 50
When must the value of maximum open database connections be increased?
If you see the following messages within the ~/work/logs/server-0.0.log even if the DatabaseServiceWatchdog is appearing every 5 minutes within the server log file:
WARNING: S001: DatabaseService: EventServiceWatchdog: maximum number of connections in use, blocked further accessINFO : T013: HotfolderCheckinNew.processEvents: Service: uk-mal-lin-orac-01.20080915.140146.094[system]: waiting for service: DatabaseService[uk-mal-lin-orac-01:DatabaseService] database, since: 30000msServiceException[srv-ex-unavailable]: Service 'DatabaseService[uk-mal-lin-orac-01:DatabaseService]' is not availableSEVERE : DatabaseServiceWatchdog: DatabaseService: DatabaseServiceWatchdog: corpus: limit of maxOpen connections [100] has been reached, could not open new connectionWhere to configure it and what to consider?
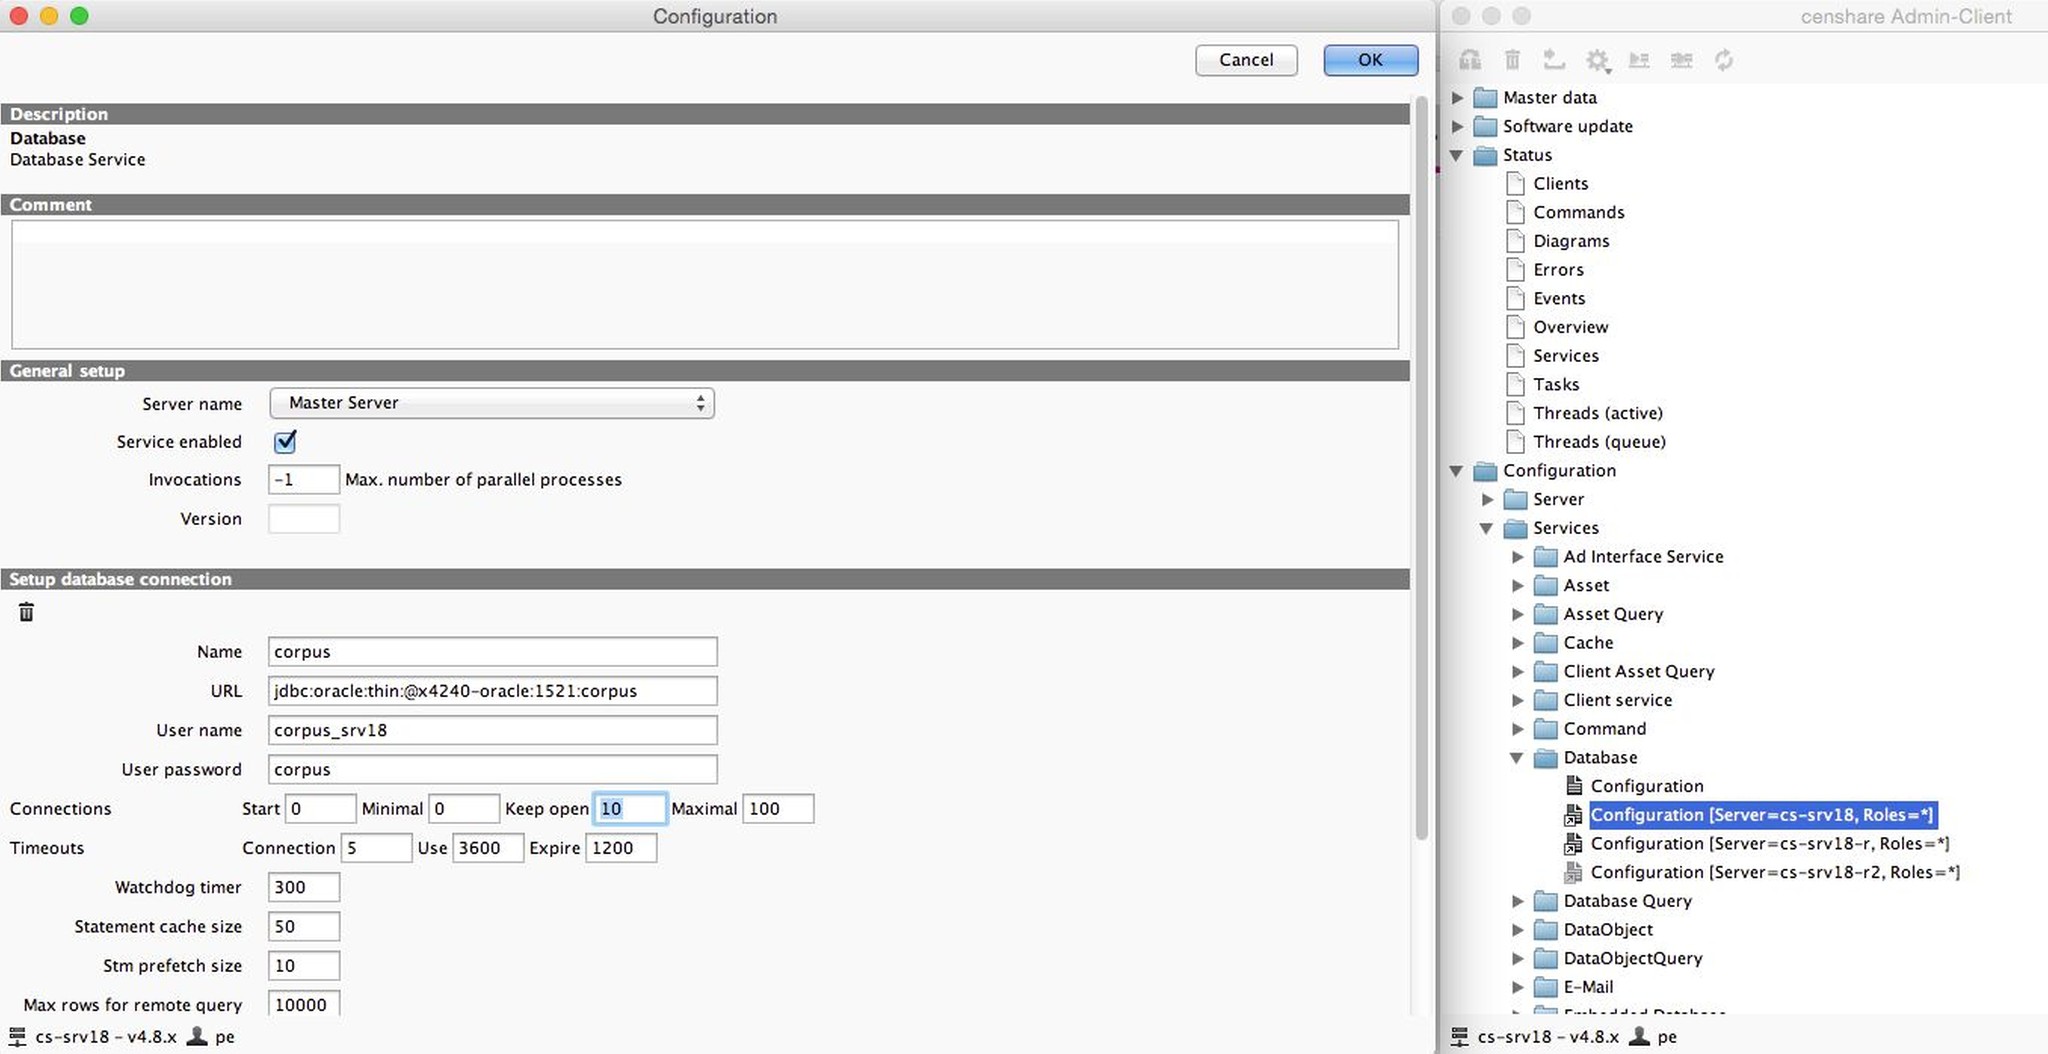
You can configure the max-open parameter within censhare-Admin Client at Configuration | Services | Database or directly within the file ~/cscs/app/services/database/config.<server>.xml .
Normally a (remote) configuration refresh is sufficient. Sometimes (e.g. if all database connections are currently exhausted) this requires an application server (JVM) restart.
How about a little performance optimization?
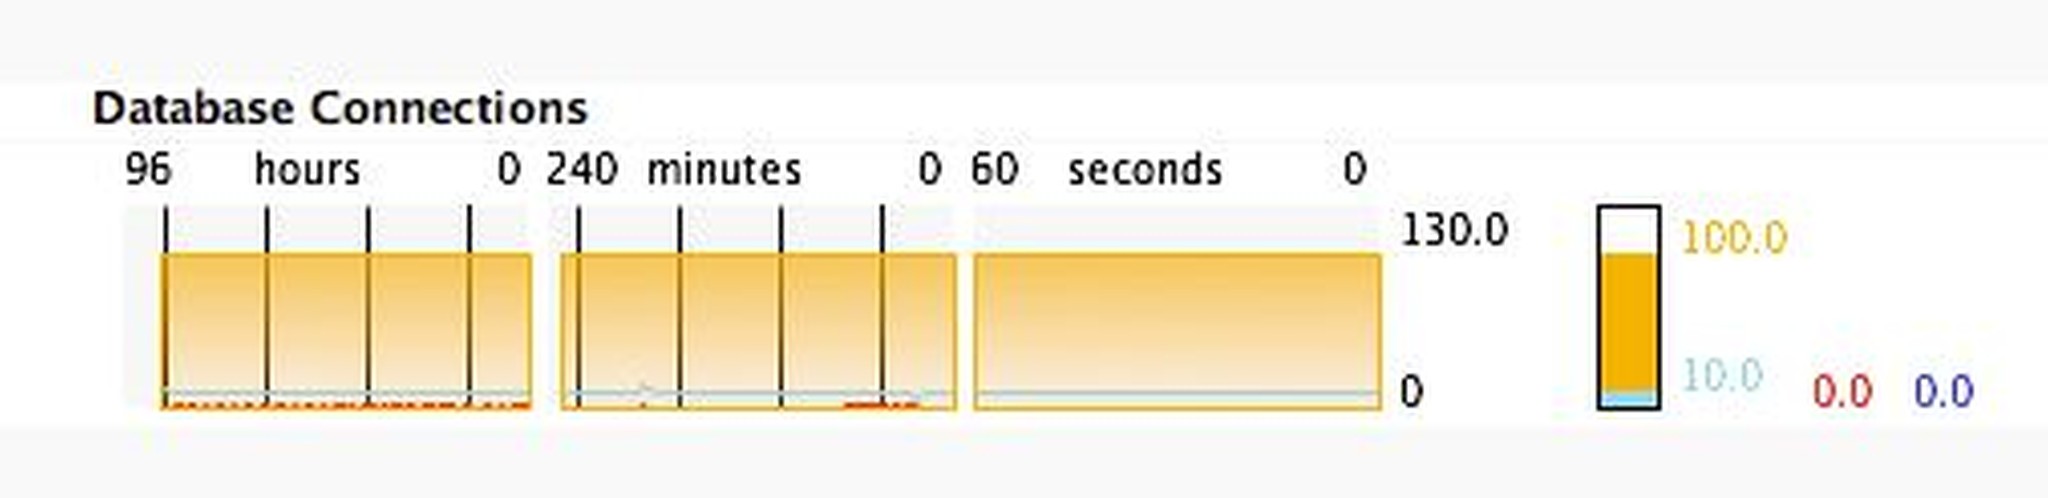
The keep-open parameter should be set to the average used database connections (could be found out within the Diagrams / Database Connections)
Background: From a resources view it's cheaper and faster (in the area of milliseconds) to keep a database connection open, compared to opening a new database connection each time.
Troubleshooting
What if the DatabaseServiceWatchdog doesn't appear in the log file?
Rarely it happens that the DatabaseServiceWatchdog is blocked by a thread or while trying to close a physical database connection. As a result unused database connections won't be released and the pool of maximum open database connections gets exhausted. With the following command you can check if the DatabaseServiceWatchog is appearing every 5 minutes:
grep "DatabaseServiceWatchdog:.*checking connections" ~/work/logs/server-0.0.logIf it doesn't appear it indicates that it is in some kind blocked. For further analysis you need to create a series of jstacks with the cssjstack alias output of the application server java process. Keep in mind that an older (lower than ~/css/app/common/lib/ojdbc6-v11.2.0.2.4.jar) version of the jdbc driver could lead to blocked physical connection, too.
The following example jstack output shows a BLOCKED DatabaseServiceWatchdog. It describes only one of many possible causes to show the analysis method.
"DatabaseServiceWatchdog" prio=3 tid=0x000000001a67d000 nid=0xa823 waiting for monitor entry [0xffff80ff7bd0d000]
   java.lang.Thread.State: BLOCKED (on object monitor)
	at oracle.jdbc.driver.PhysicalConnection.closeLogicalConnection(PhysicalConnection.java:4010)
	- waiting to lock <0x000000046623c4c8> (a oracle.jdbc.driver.T4CConnection)
	at oracle.jdbc.driver.LogicalConnection.closeInternal(LogicalConnection.java:258)
	at oracle.jdbc.pool.OraclePooledConnection.getConnection(OraclePooledConnection.java:306)
	- locked <0x000000046623c408> (a oracle.jdbc.pool.OraclePooledConnection)
	at com.censhare.manager.databasemanager.DatabaseServiceImpl$DBCachedConnection.closePhysical(DatabaseServiceImpl.java:294)
...To find out by which thread the DatabaseServiceWatchdog is blocked you have to take the id 0x000000046623c4c8 of line - waiting to lock <0x000000046623c4c8> (a oracle.jdbc.driver.T4CConnection) and search for it within the stack ouput. You'll find out that it's blocked by thread T004 . This thread is corresponding to checkConstraints(WConnectionImpl.java:210) .
"T004" prio=3 tid=0x00000000028e7000 nid=0x1c runnable [0xffff80ffb74dc000]
java.lang.Thread.State: RUNNABLE
...
at oracle.jdbc.driver.OracleStatement.executeQuery(OracleStatement.java:1477)
- locked <0x000000046623c4c8> (a oracle.jdbc.driver.T4CConnection)
at oracle.jdbc.driver.OracleStatementWrapper.executeQuery(OracleStatementWrapper.java:392)
at com.censhare.server.support.wsql.WConnectionImpl.checkConstraints(WConnectionImpl.java:210)
at com.censhare.server.support.wsql.WConnectionImpl.prepareStep(WConnectionImpl.java:428)
at com.censhare.manager.dataobject.DataObjectServiceImpl.executeUpdate(DataObjectServiceImpl.java:114)
...It means that within the DatabaseService configuration the parameter is set to constraint-check-enabled="true".
Important note: for a productive system that is inappropriate and shouldn't be enabled, because if a constraint error appears every database foreign key will be checked for violation. This could possibly take up to hours which results in a blocked DatabaseServiceWatchdog.
How can I find out which thread is using a database connection?
Since censhare Server version 5 there's an option within the xml of the database service named track-allocations="false".
If you set it to true and refresh the database service you can see the transaction id of the thread which uses a database connection. With a grep for the transaction id you'll find out the censhare command/module which holds the database connection. Please find an example below:
Please note: that this debug option costs performance, therefore it should be disabled within production envionments.
grep "DatabaseServiceWatchdog:.*was last accessed by" ~/work/logs/server-0.0.log
...
2015.03.13-11:48:40.971 INFO   : DatabaseServiceWatchdog: DatabaseService: DatabaseServiceWatchdog: used connection[116] was last accessed by server.20150313.113841.018: 2015-03-13T10:48:16.894Z
...

grep server.20150313.113841.018 ~/work/logs/server-0.0.log
...
2015.03.13-11:49:16.898 INFO   : T061: CommandExecutor: server.20150313.113841.018[system]: content_export2.aa-content-export2-20140716-1114-0 error in 90006ms
...Since Versions 2017.5.0, 2017.4.0, 2017.3.4 and higher the log output has further improved. Instead of logging "null tm!" you'll find "no context[unknown][unknown]" as information (There are many database connections triggered in the censhare Server without any transaction context and may be performed for example by background processes. Those connections does not have a command-id and therefore it can't be logged). Besides that the output is enhanced to not only log the transaction-id, but additionally the command-name and user if possible.
grep "DatabaseServiceWatchdog:.*was last accessed by" ~/work/logs/server-0.0.log
2017.07.12-12:34:19.751 INFO : DatabaseServiceWatchdog: DatabaseService: DatabaseServiceWatchdog: used connection[203] was last accessed by server.20150313.113841.018[export-combine.pdf][censhare]: 2017-07-12T10:34:15.394Z