Short description of the following content
In this document we show how you can get embedded database statistics and how to interpret the important values from a support perspective. Please note that we use several names for the embedded database -> cache db, cdb, censhare-db, embedded database
1. How to get embedded database statistics
You can get the cdb statistics very easy when you login with admin client and perform the action called "Embedded database statistics". A new window with the statistics will open. This action is available by default.

2. How to interpret the important values
Important hints
-
Time node/data read/write is reported in microseconds (us), not milliseconds.
-
Time cleaner scan/move is reported in milliseconds (ms).
-
Read/write values higher than <8192 pointing to real disk access.
-
The examples below showing a good performance.
Cache read/writes
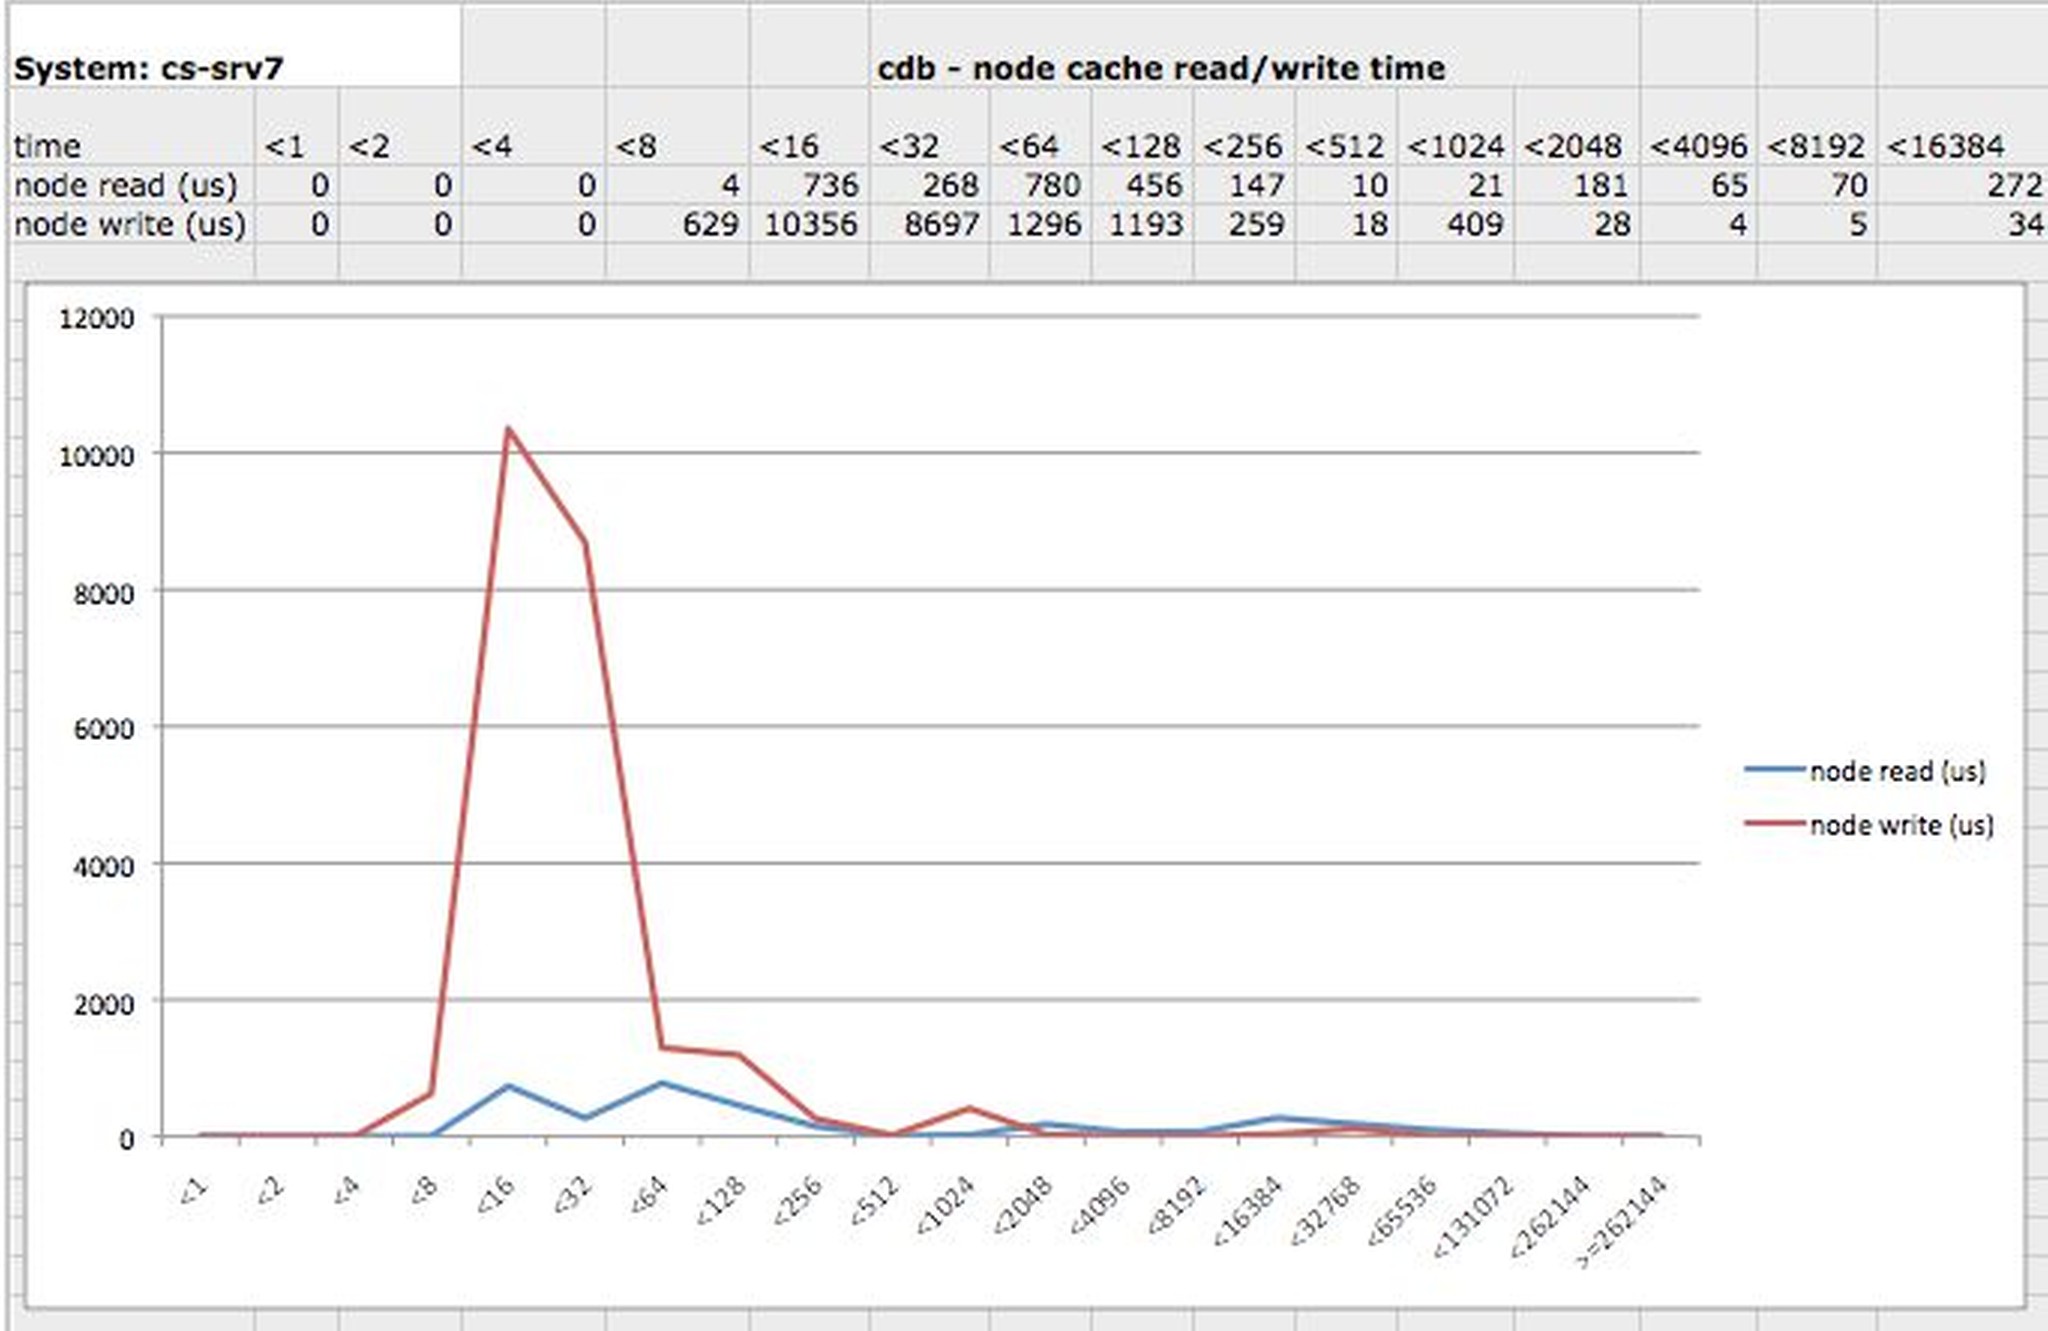
Node cache reads:

since the last statistics reset, 3325 node cache reads were made
735 node reads took between 0,008 and 0,016 ms
47 node reads took between 65,536 and 131,072 ms
Node cache writes:

since the last statistics reset, 22105 node cache writes were made
9737 node writes took between 0,008 and 0,016 ms
77 node writes took between 65,536 and 131,072 ms
Data cache reads:

since the last statistics reset, 96408 data cache reads were made
40252 data reads took between 0,004 and 0,008 ms
636 data reads took between 65,536 and 131,072 ms
Data cache writes:

since the last statistics reset, 194809 data cache writes were made
150692 data writes took between 0,00 and 0,004 ms
169 data writes took between 65,536 and 131,072 ms
Create a graph
You can create your cdb cache performance graphs when you copy&paste the values from the statistics window into this file cdb-statistics-template.xlsx
Node cache graph:

Data cache graph:

Cache hit rates
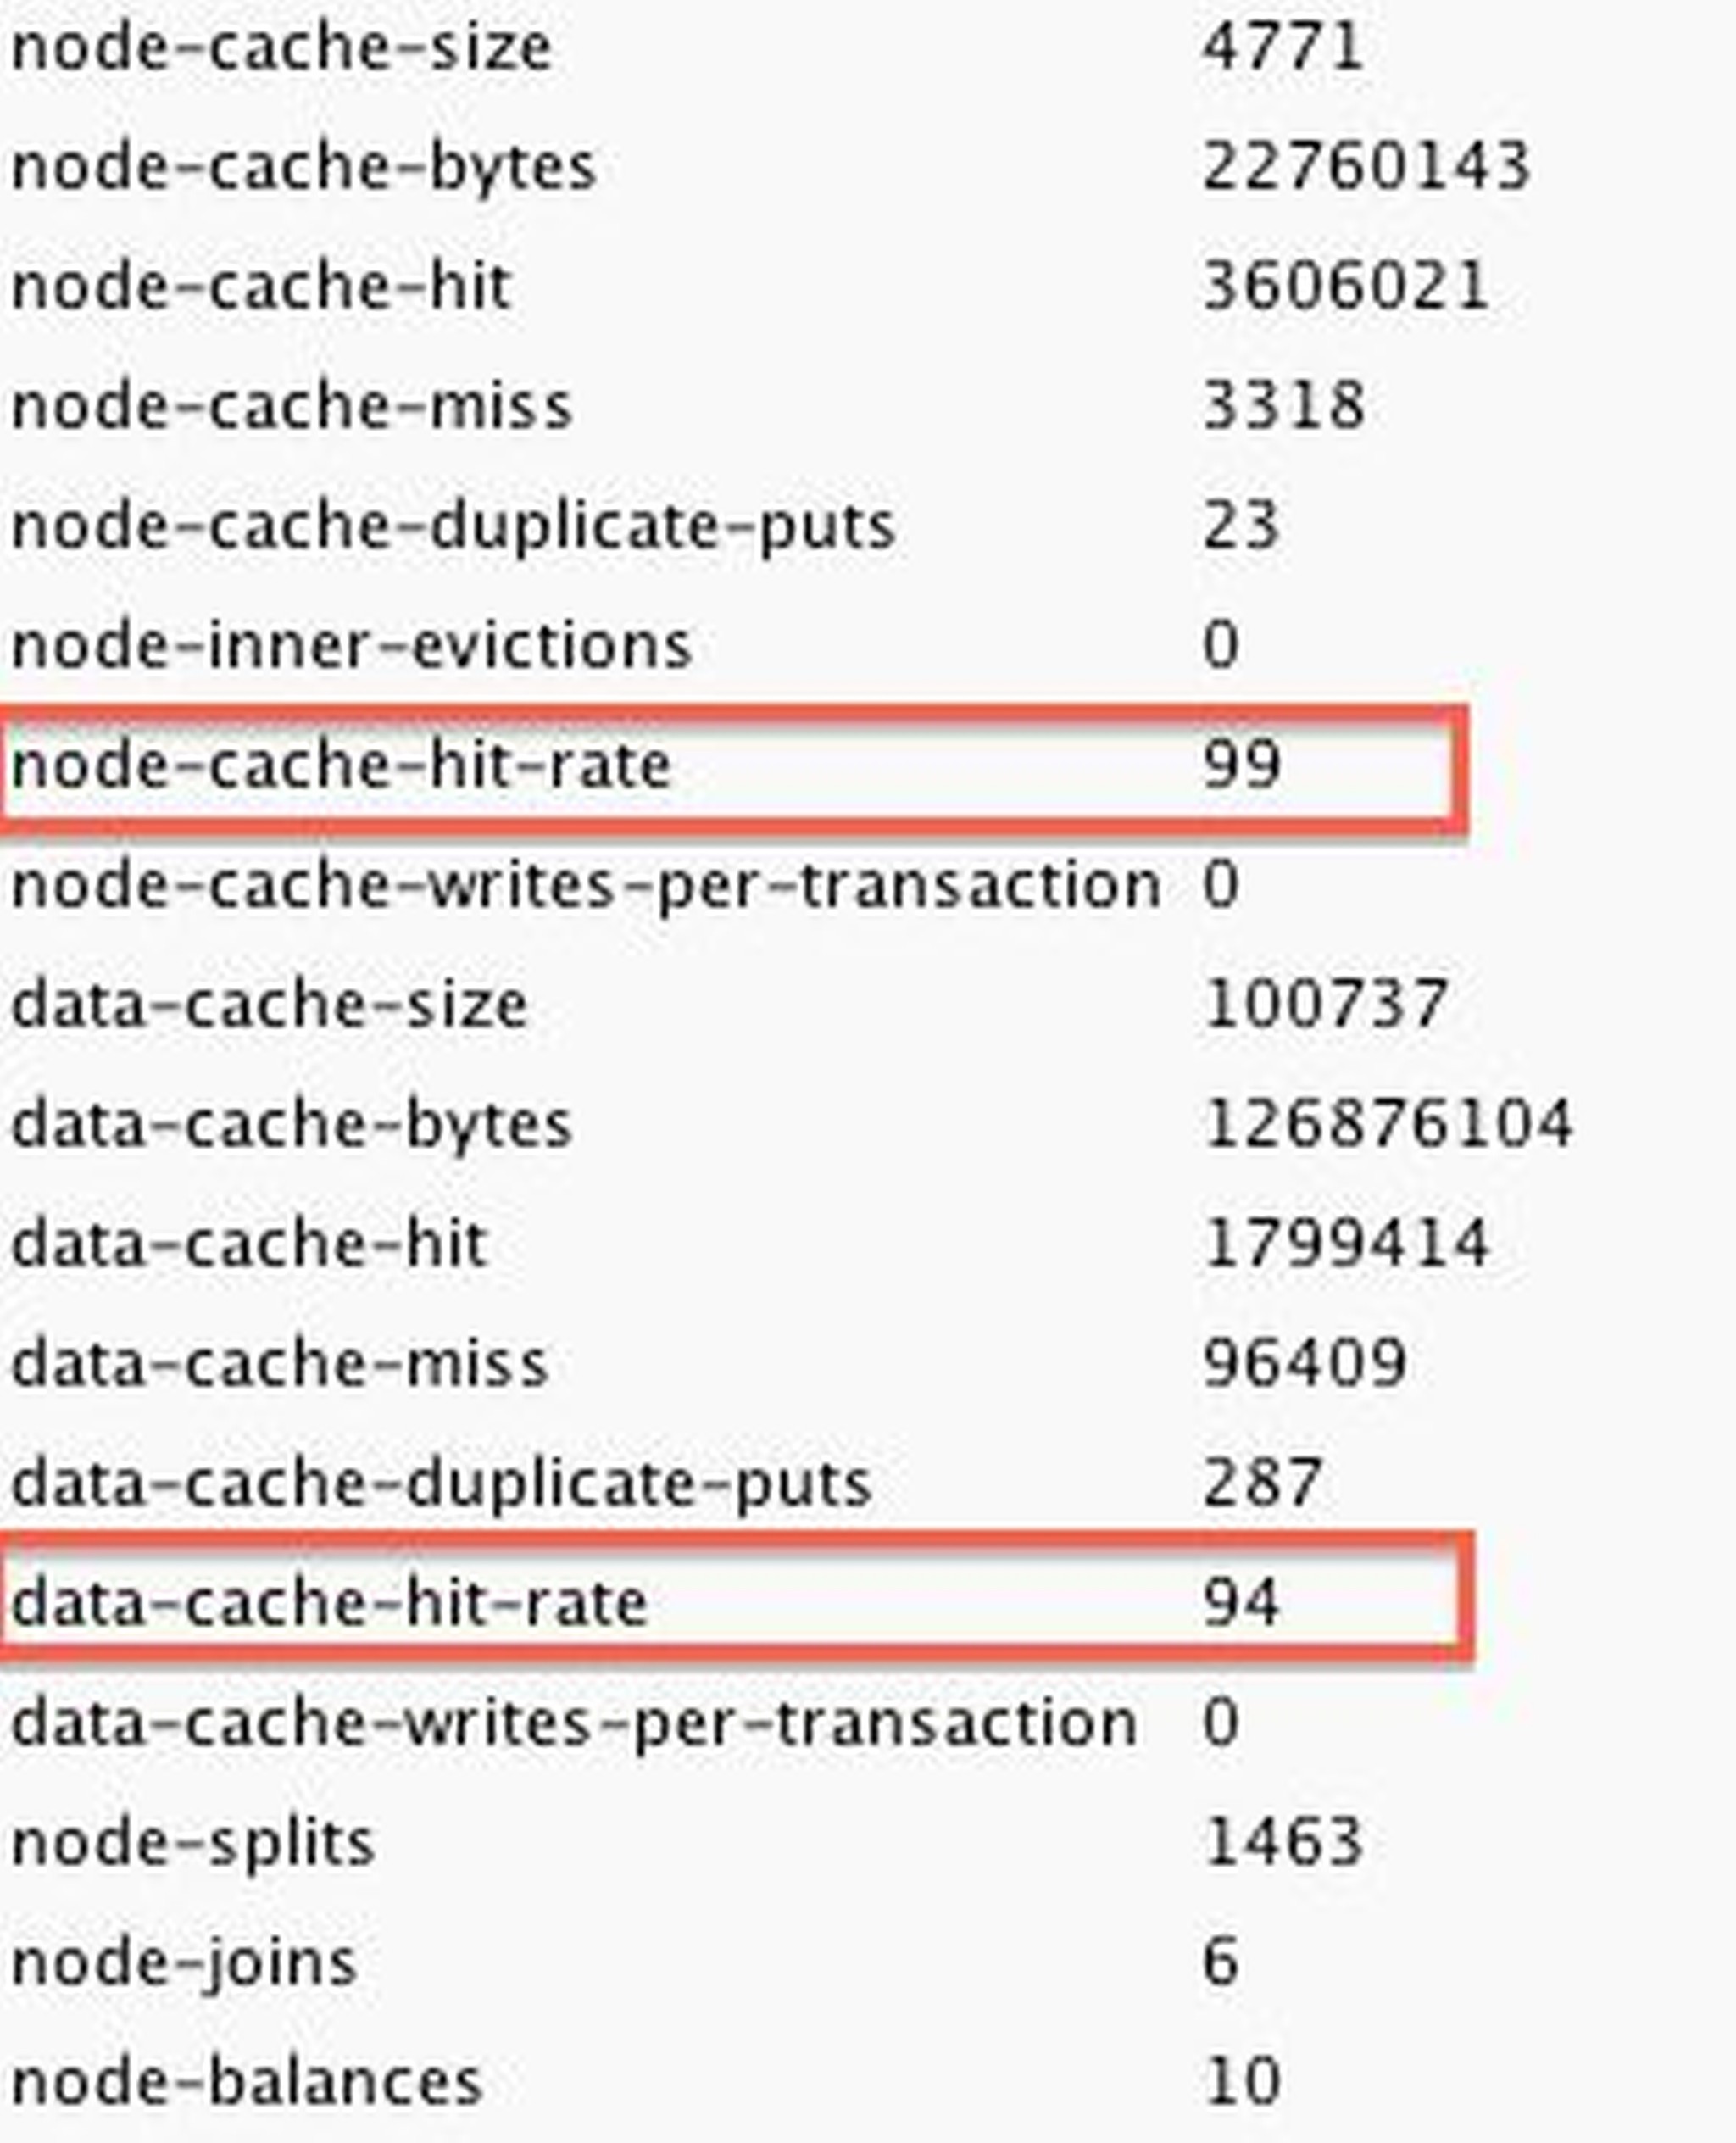
The node- and data-cache-hit-rate are the most interesting values of the statistics.
The node-cache-hit-rate shows the system performance.
-
Values between 97-99% are good and usual.
Data-cache-hit-rate is not such important.
Values below 90% should be a reason for increasing the data cache size.

cdb files statistics
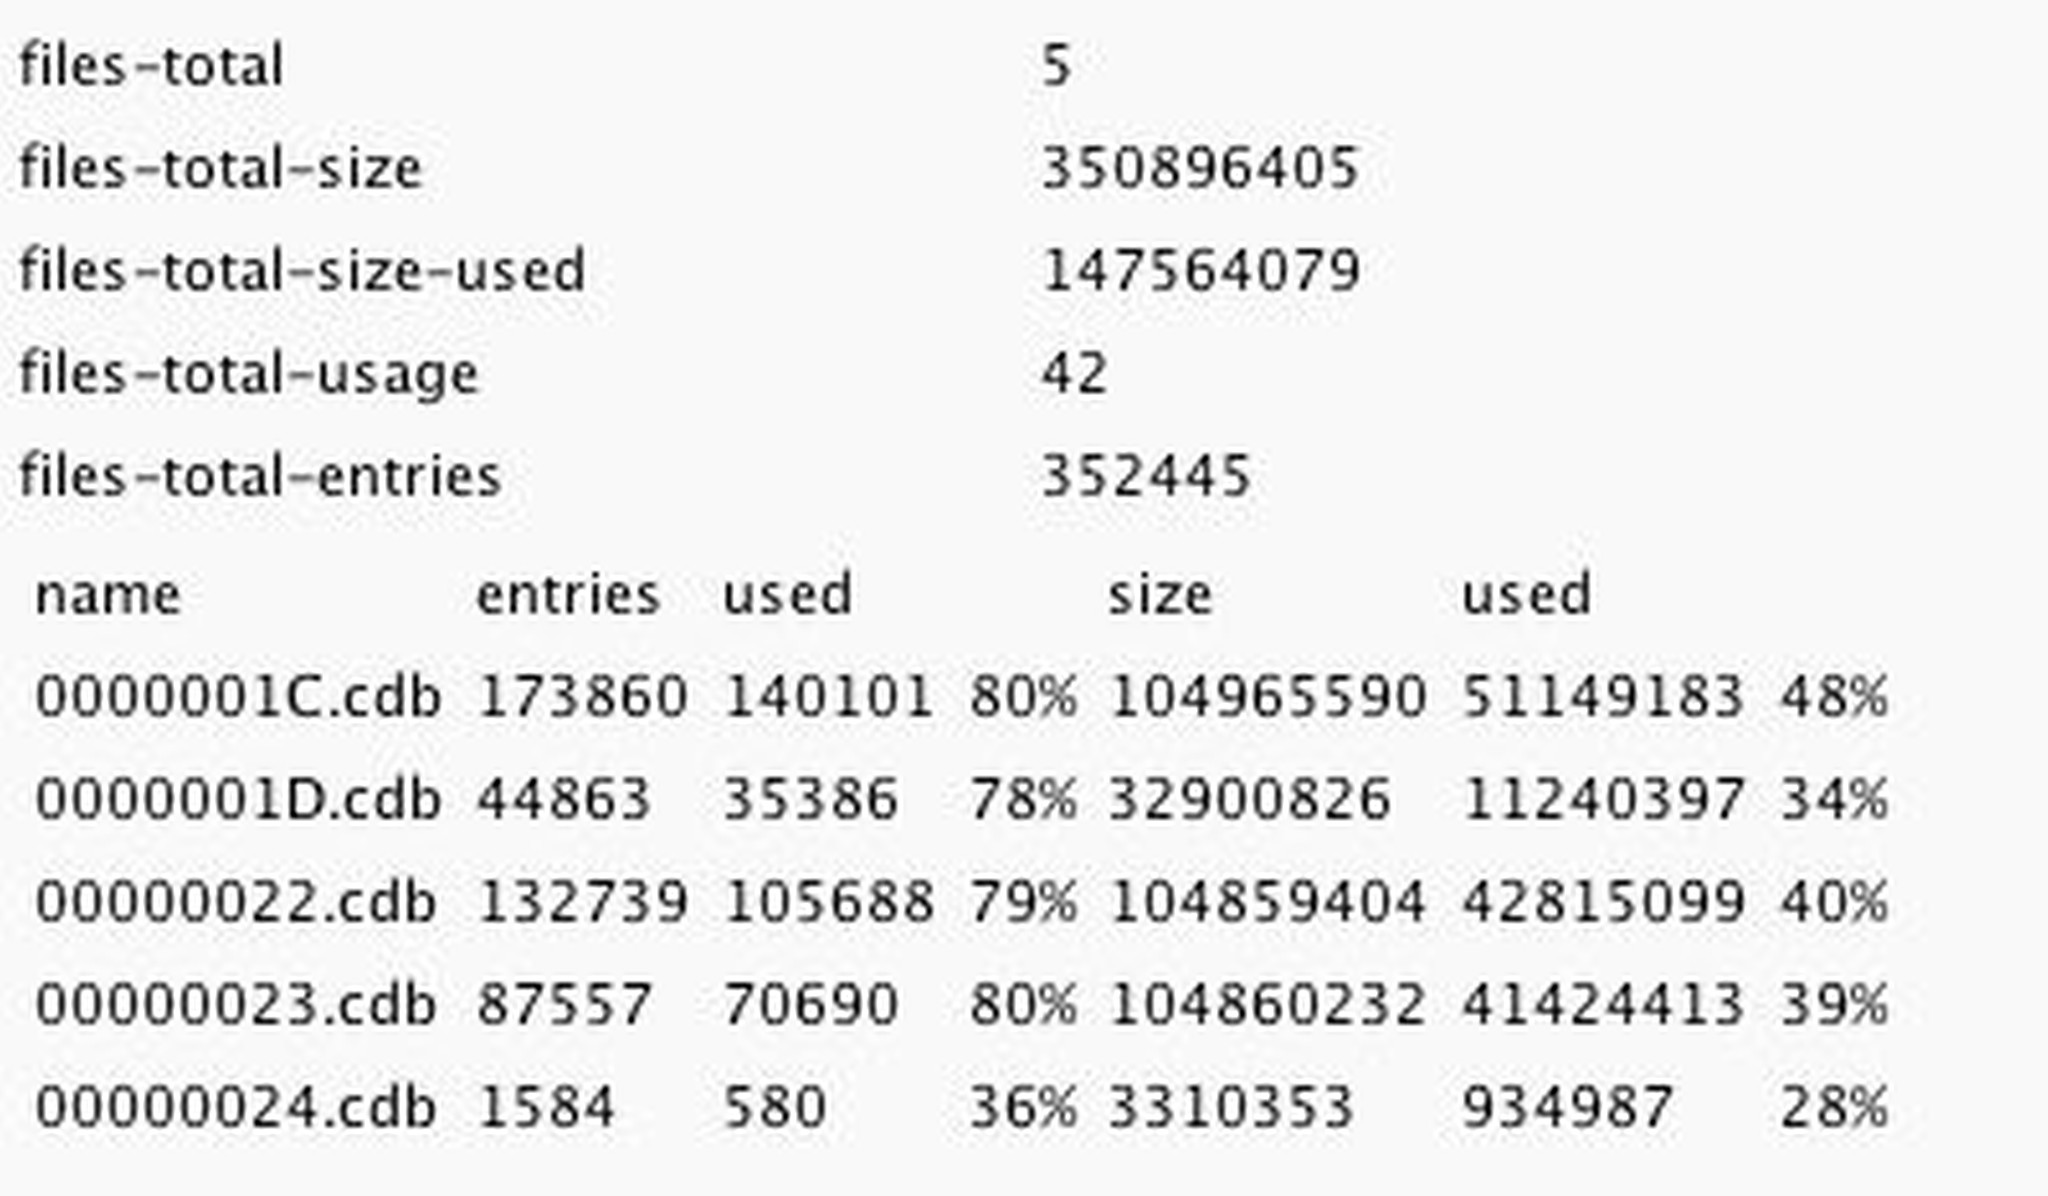
In the lower part of the statistics you will find the main information about the cdb files

-
files-total is a counter of all files
-
files-total-size is the used space by all files in byte. xx/1024/1024=GB
-
files-total-size-used is the amount of used space within the files in byte.
-
files-total-usage is the percentage how much of the file content is still in use
-
files-total-entries is the percentage how much entries are in all files
-
At last you get a list of all files with percentage for the used content and used entries in each file
.png)