This article should help you troubleshooting problems with the AssetQueryService.
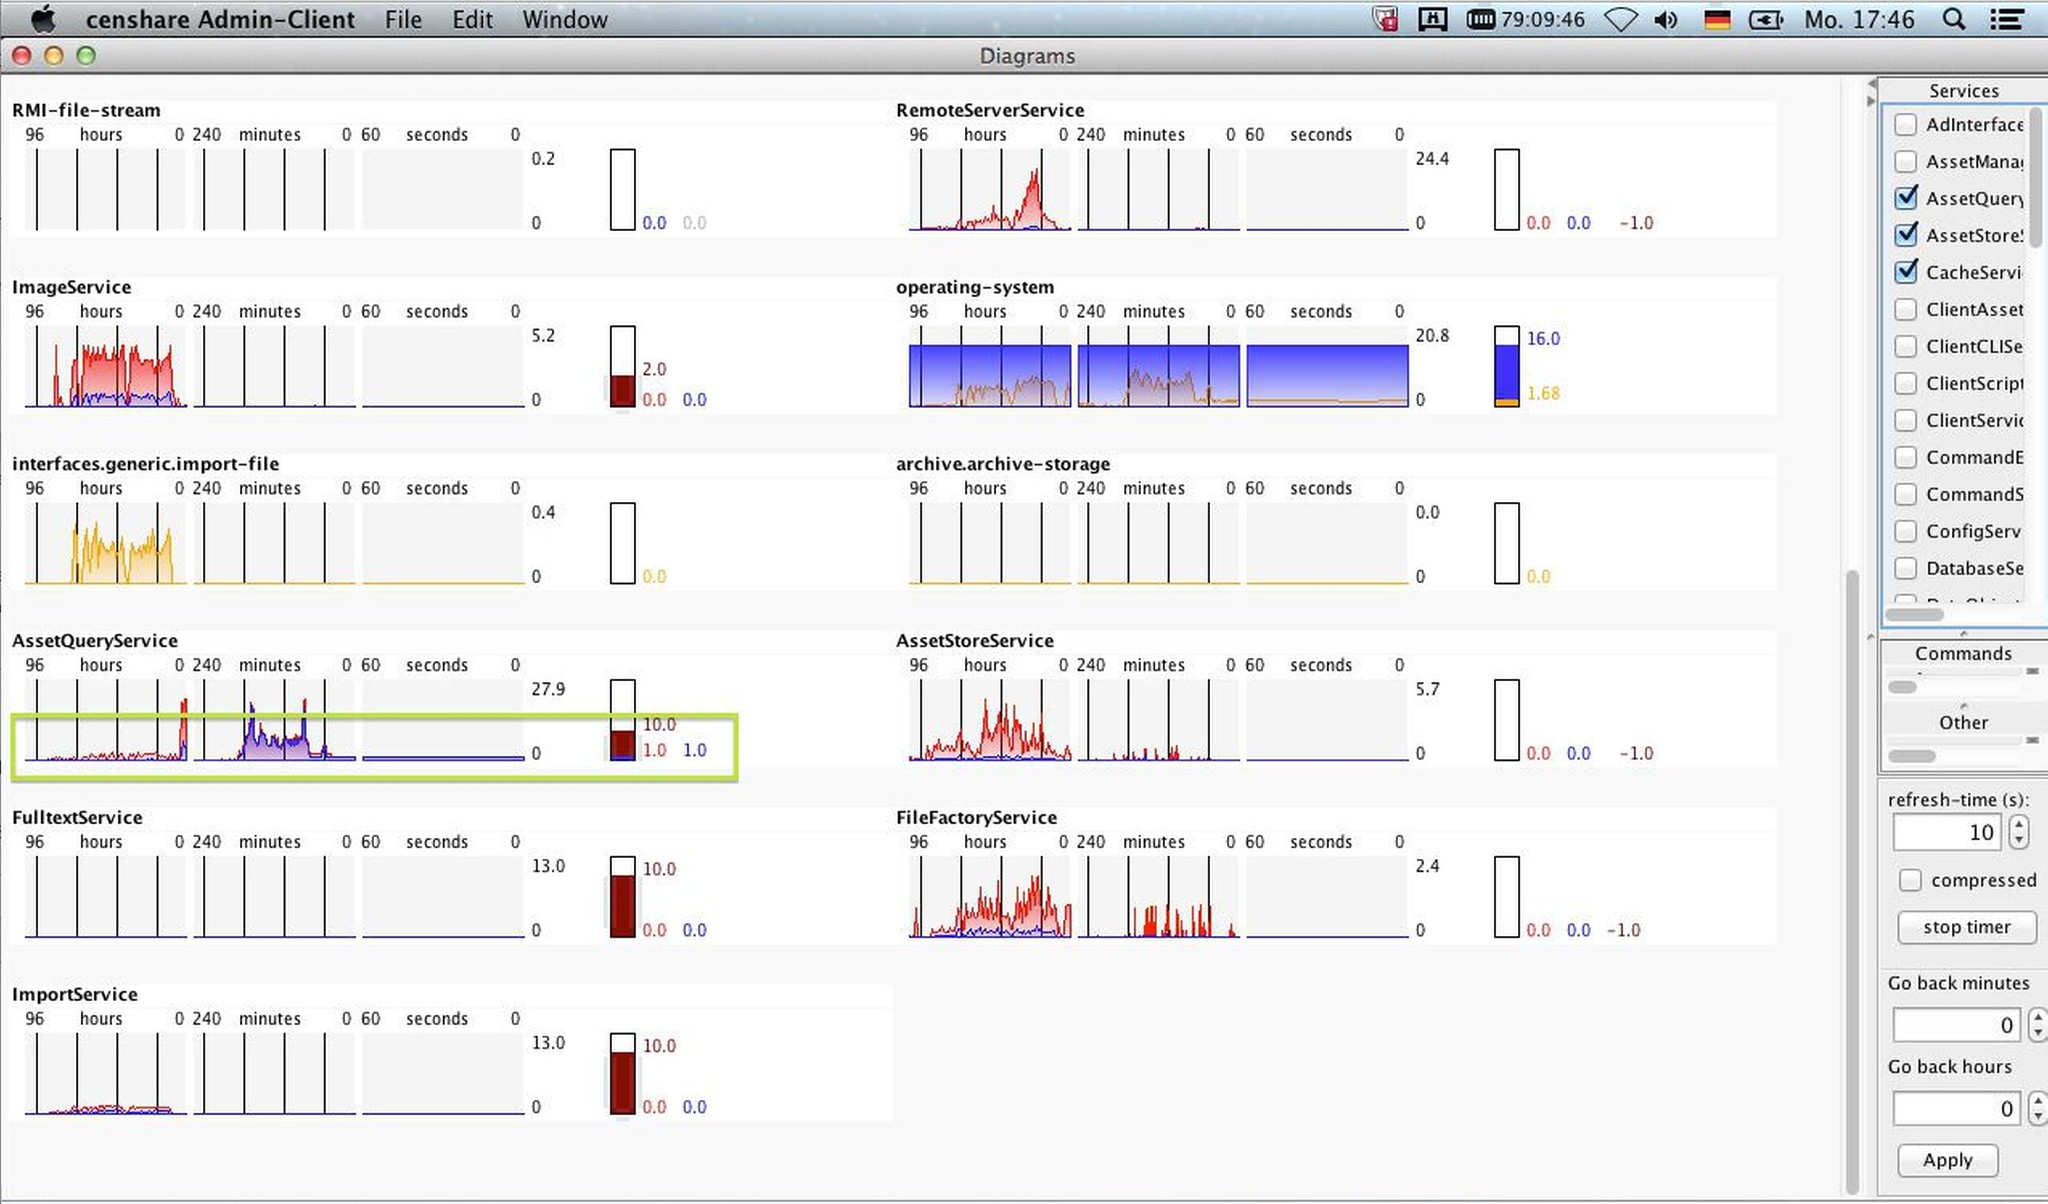
Admin Client Diagrams
If the AssetQueryService wants to use more than the configured instances ...

Error message
You get the error message (stack trace) within the Client or Server
|
Caused by: com.censhare.server.rmi.RMIServerException[srv-ex-unavailable]: Service 'AssetQueryService[xxx:AssetQueryService]' is not available |
|---|
Thread dump (jstack)
One or more thread dump outputs from jstack of the running server process (java) like the following could help to see that the query was called by the client. Probably you can find a lot of these entries within the jstack output.
"T033: Query.standardQuery" prio=10 tid=0x00007f6f32985800 nid=0x7e82 runnable [0x00007f70596a6000]
   java.lang.Thread.State: RUNNABLE
	at com.censhare.db.iindex.DocsOp$OpMultiOr.addAll(DocsOp.java:615)
	at com.censhare.db.iindex.Docs.or(Docs.java:80)
	at com.censhare.db.iindex.IIndexQueryFeature.evaluateQuery(IIndexQueryFeature.java:360)
Checking the server log file
With the thread number from the jstack - in this example T033 - and the timestamp of the jstack - you can search within the server-0.0.log. Possibly you have to check a few of these T0xx numbers, because due to the fact that all AssetQueryService instances are blocked also tiny queries may take longer. In this case temporarily increasing the AssetQueryService instances and restarting the Censhare Server afterwards helped to get rid of these false positives. Directly after the restart (discuss a maintenance window with the customer) you should furthermore create a thread dump and analyze it.
Concrete example
In one case then we've found a long running task. This was blocking one instance of the AssetQueryService for one hour. And there were a few of these queries active in parallel:
|
grep "asset.query.*in [0-9][0-9][0-9][0-9][0-9][0-9]" ~/work/logs/server-0.0.log |
|---|
|
2014.03.03-10:51:57.868 FINER : T033: Query.standardQuery: EmbeddedQueryEngine: xxx.20140303.095031.674[pe]:
|
|---|
|
grep "Query.standardQuery.*done in [0-9][0-9][0-9][0-9][0-9][0-9]" ~/work/logs/server-0.0.log |
|---|
Analyzing
After executing the server action Logger Manager within Admin Client (must be activated at Modules|Administration|Logger Manager) and setting the log level from FINE to FINER for logger com.censhare.db.qb.asset.EmbeddedQueryEngine we've found out (server-0.0.log) that most of the time was spent to evaluate a feature, in our example: xxx:pe_number
|
2014.03.03-10:46:16.329 FINER : T046: Query.standardQuery: EmbeddedQueryEngine: xxx.20140303.094548.711[pe]: evaluate feature(xxx:pe_number NOTNULL null) done in 3627607ms. |
|---|
Root cause
But why could such a query overload the AssetQueryService instances?
The answer is that the feature xxx:pe_number was used within the My Task default search which was customized by the customer himself.
Workaround
As a fast workaround a new My Task default search which doesn't contain the search for this feature was created.
Solution

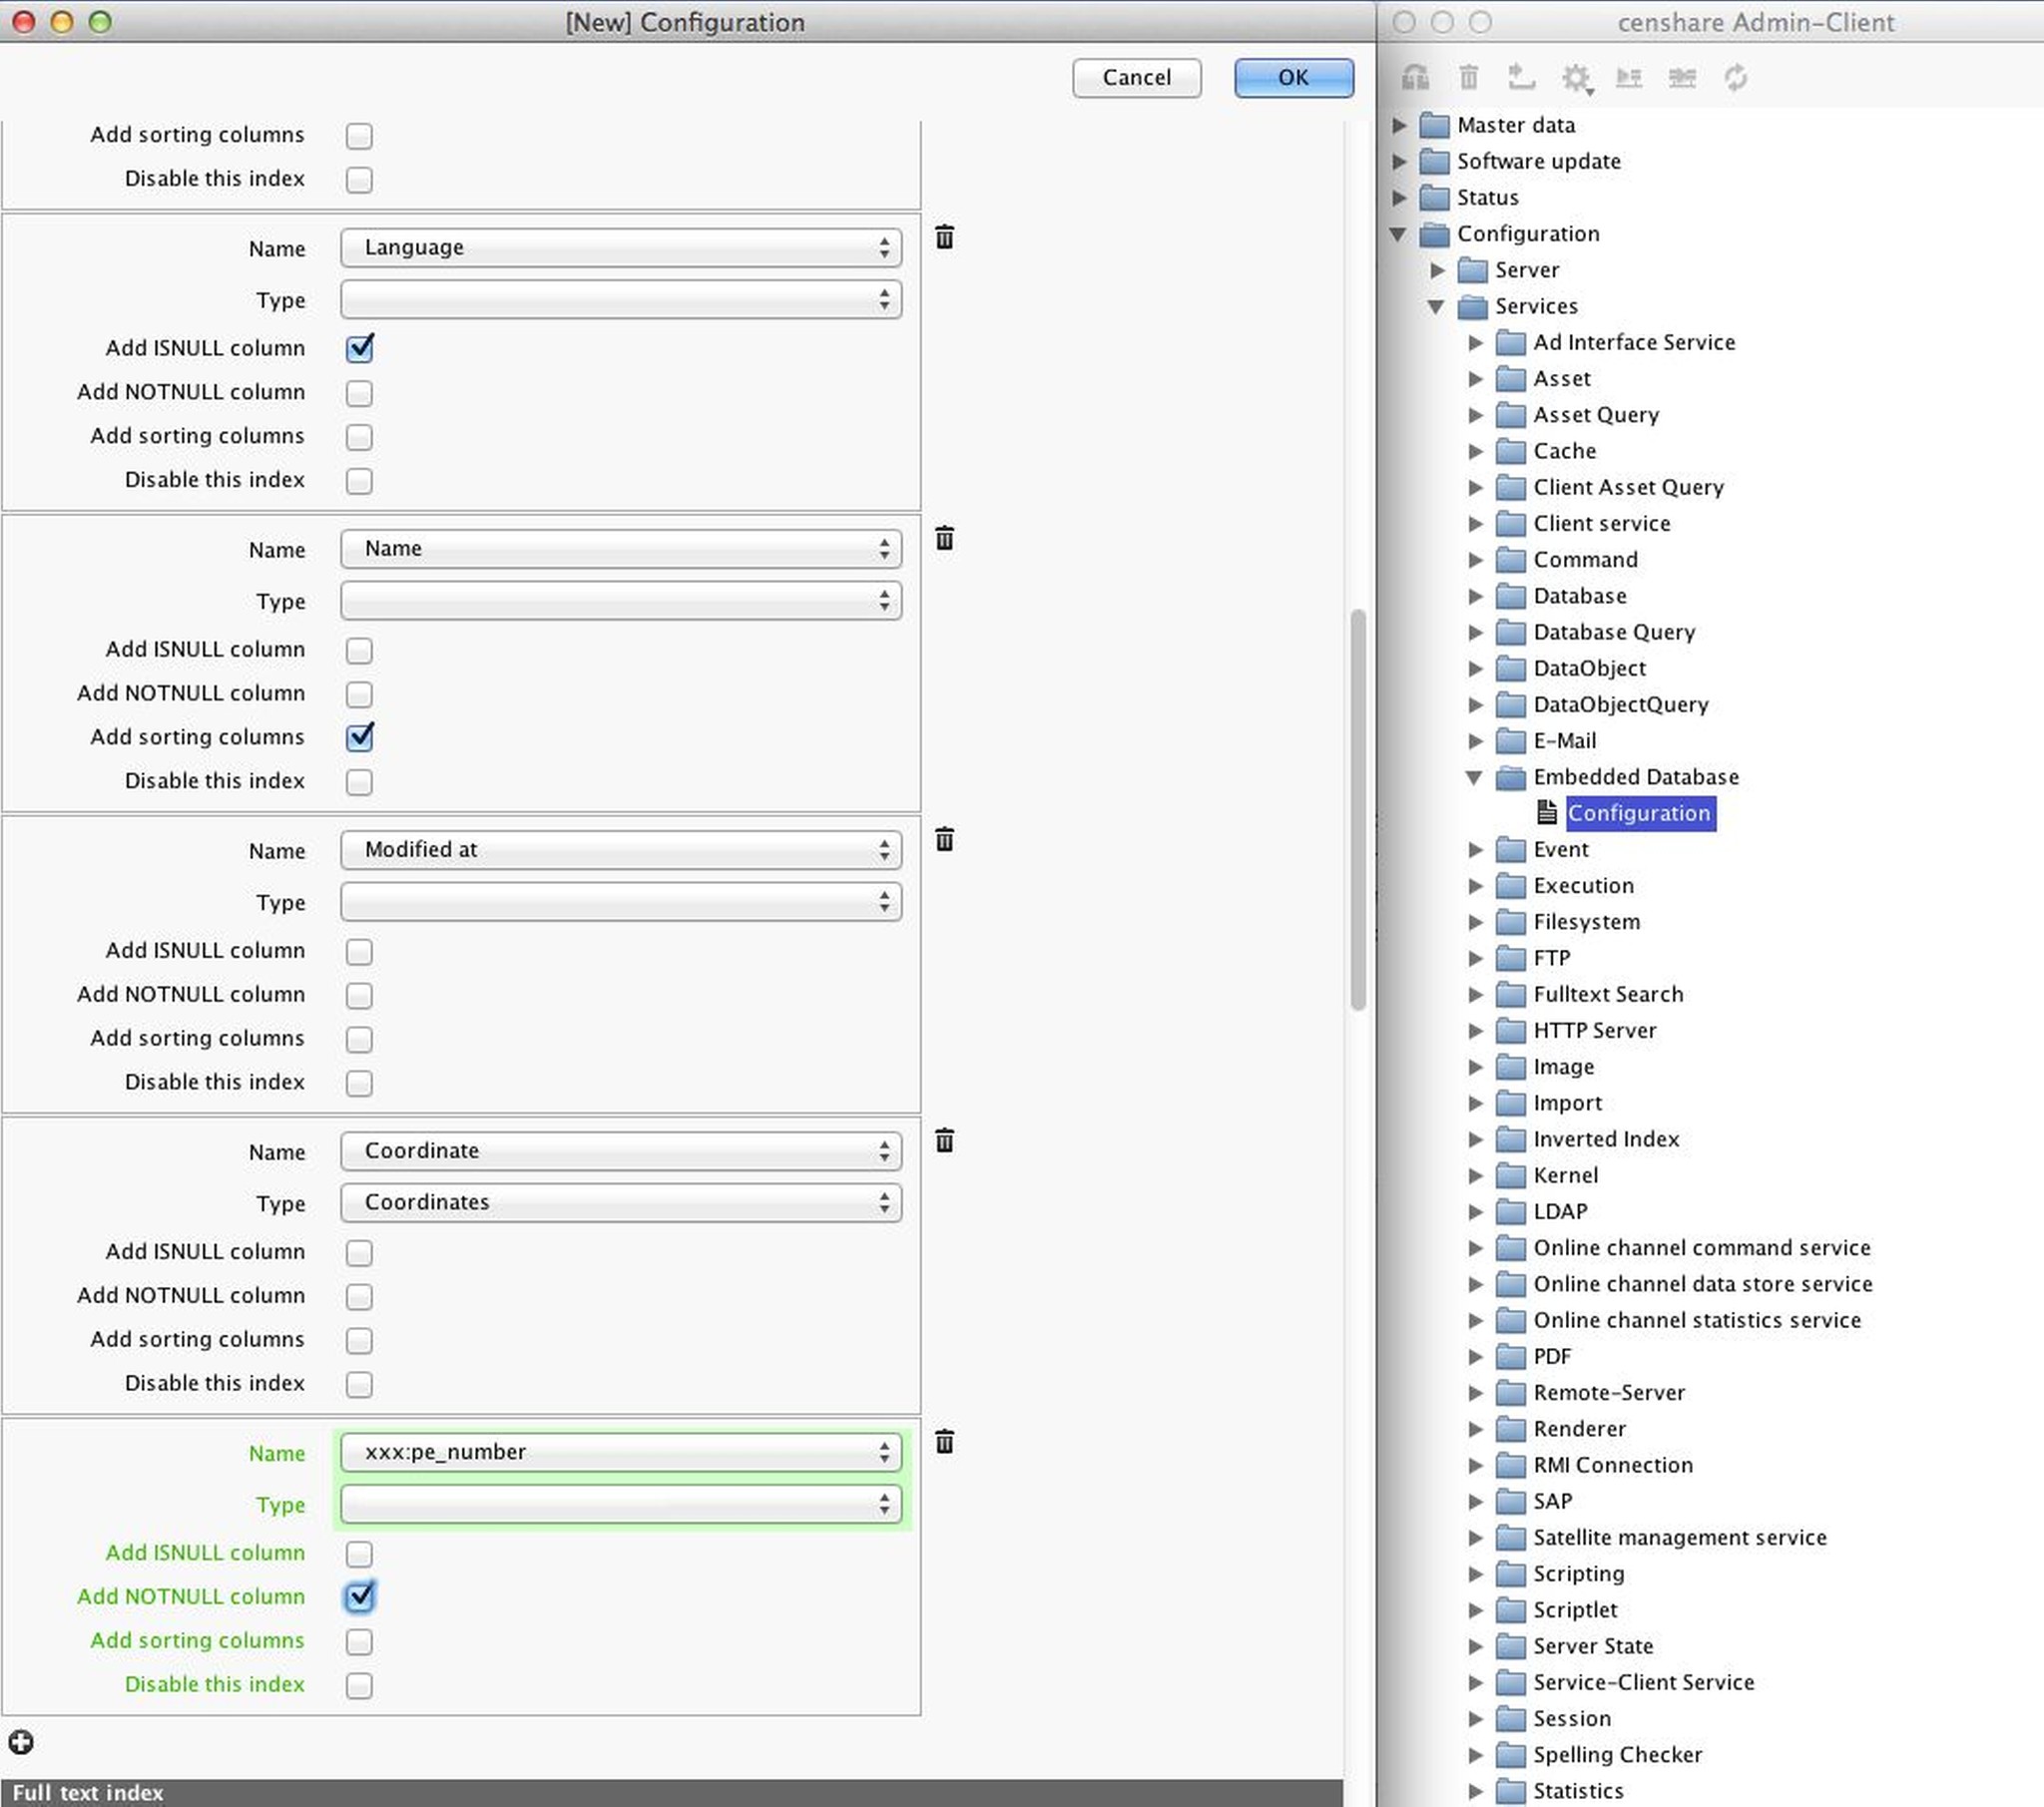
In order to avoid such long running queries an index was created for the feature xxx:pe_number with the setting "add NOTNULL column" within the CDB configuration. This required a CDB rebuild.
.png)