How to - Client Logging - Getting performance data of a defined Censhare Client task
To find the cause of a performance problem, we need detailed data of the slow client action.
Here you can find the way how to gather this performance data.
/*<![CDATA[*/ div.rbtoc1772806242418 {padding: 0px;} div.rbtoc1772806242418 ul {list-style: disc;margin-left: 0px;} div.rbtoc1772806242418 li {margin-left: 0px;padding-left: 0px;} /*]]>*/ Collect Client Performance Data Collect Server Performance Data
Collect Client Performance Data
-
logon to the [censhare] Application Server.
-
Switch Censhare Client into admin mode.
-
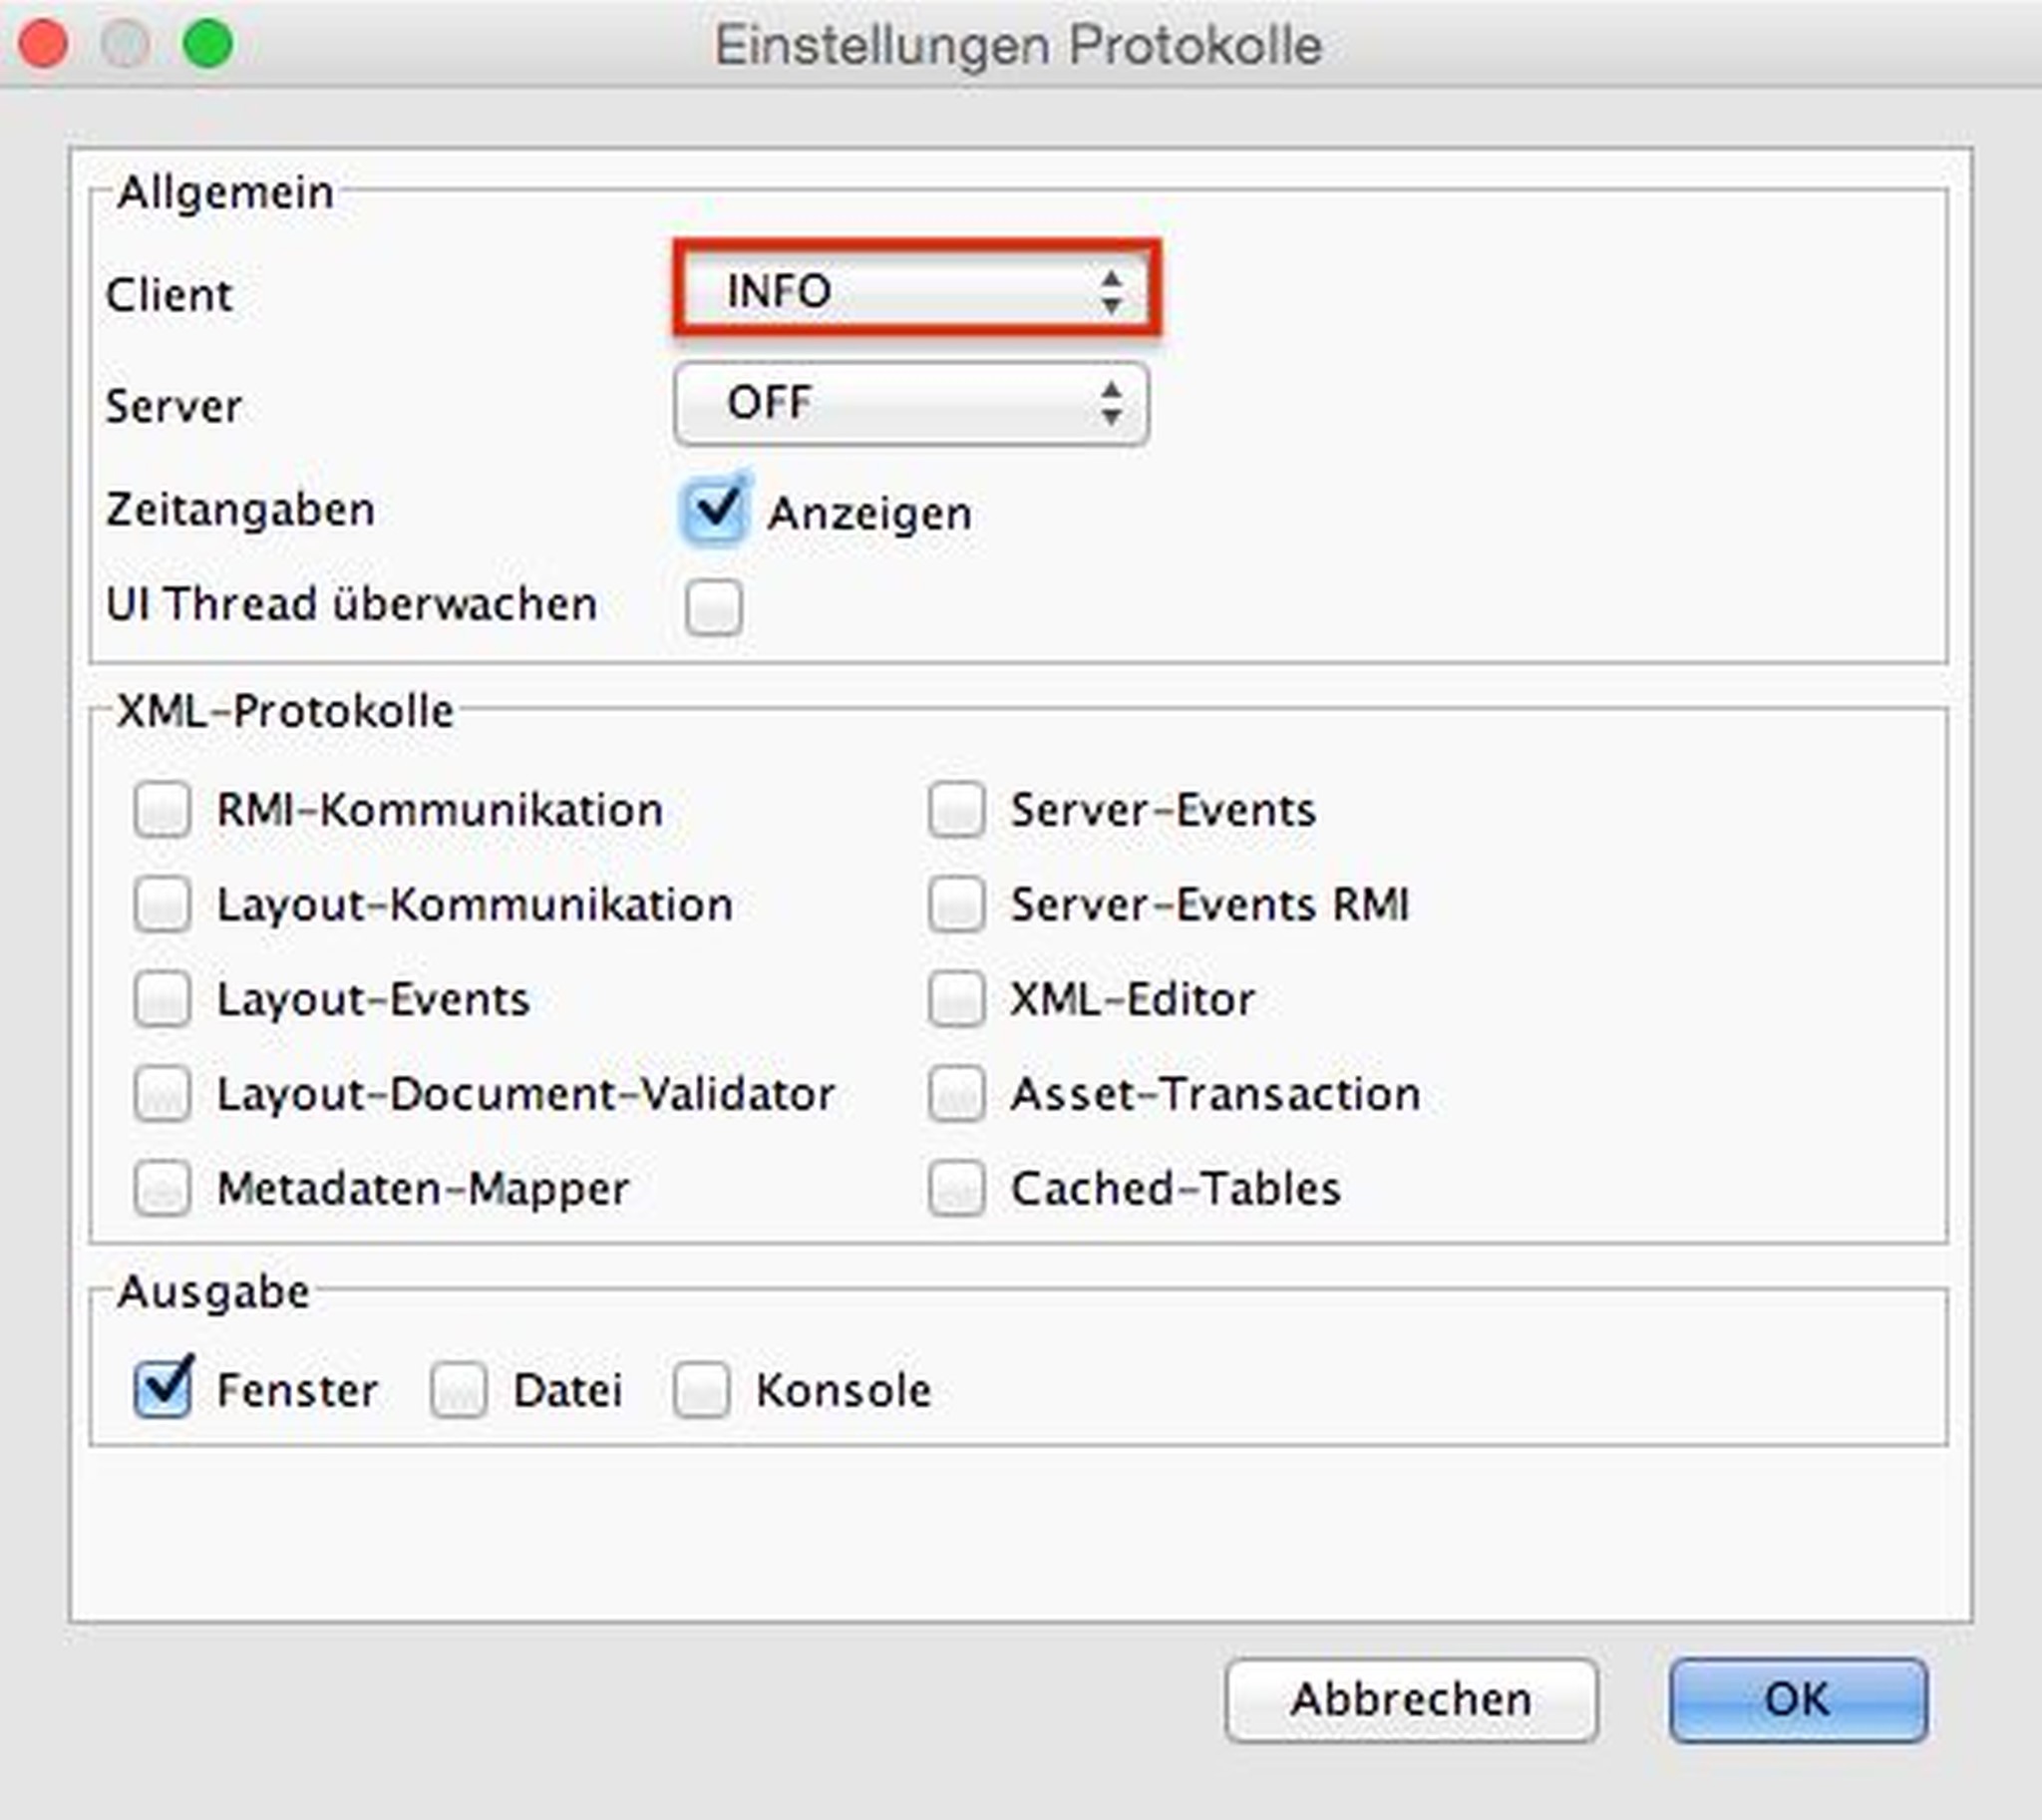
go to the menu "File/Preferences/Logs..." and activate only "General/Client/" to level "INFO" and "General/Trace time". Be sure to set the "Output" to "Window"

-
Perform the task you want to measure (e.g. checkout)
-
You will get a new "Logs"-window with three tabs. Save the contents of the "Logs"-tab. With this information we can analyse what happened

-
If you want to get the performance data of a further action, delete the current protocols by pressing the trash button
-
Perform the next task you want to measure (e.g. checkin)
-
again save the content of the "Logs"-tab
Please do not forget to deactivate all logging settings in the menu "File/Preferences/Logs..." after your tests in order to avoid client performance issues.
Collect Server Performance Data
-
logon to the [censhare] Application Server. In case of remote server environment, login to a server with a direct database connection (only so we get the Oracle Statement timing)
-
Switch Censhare Client into admin mode.
-
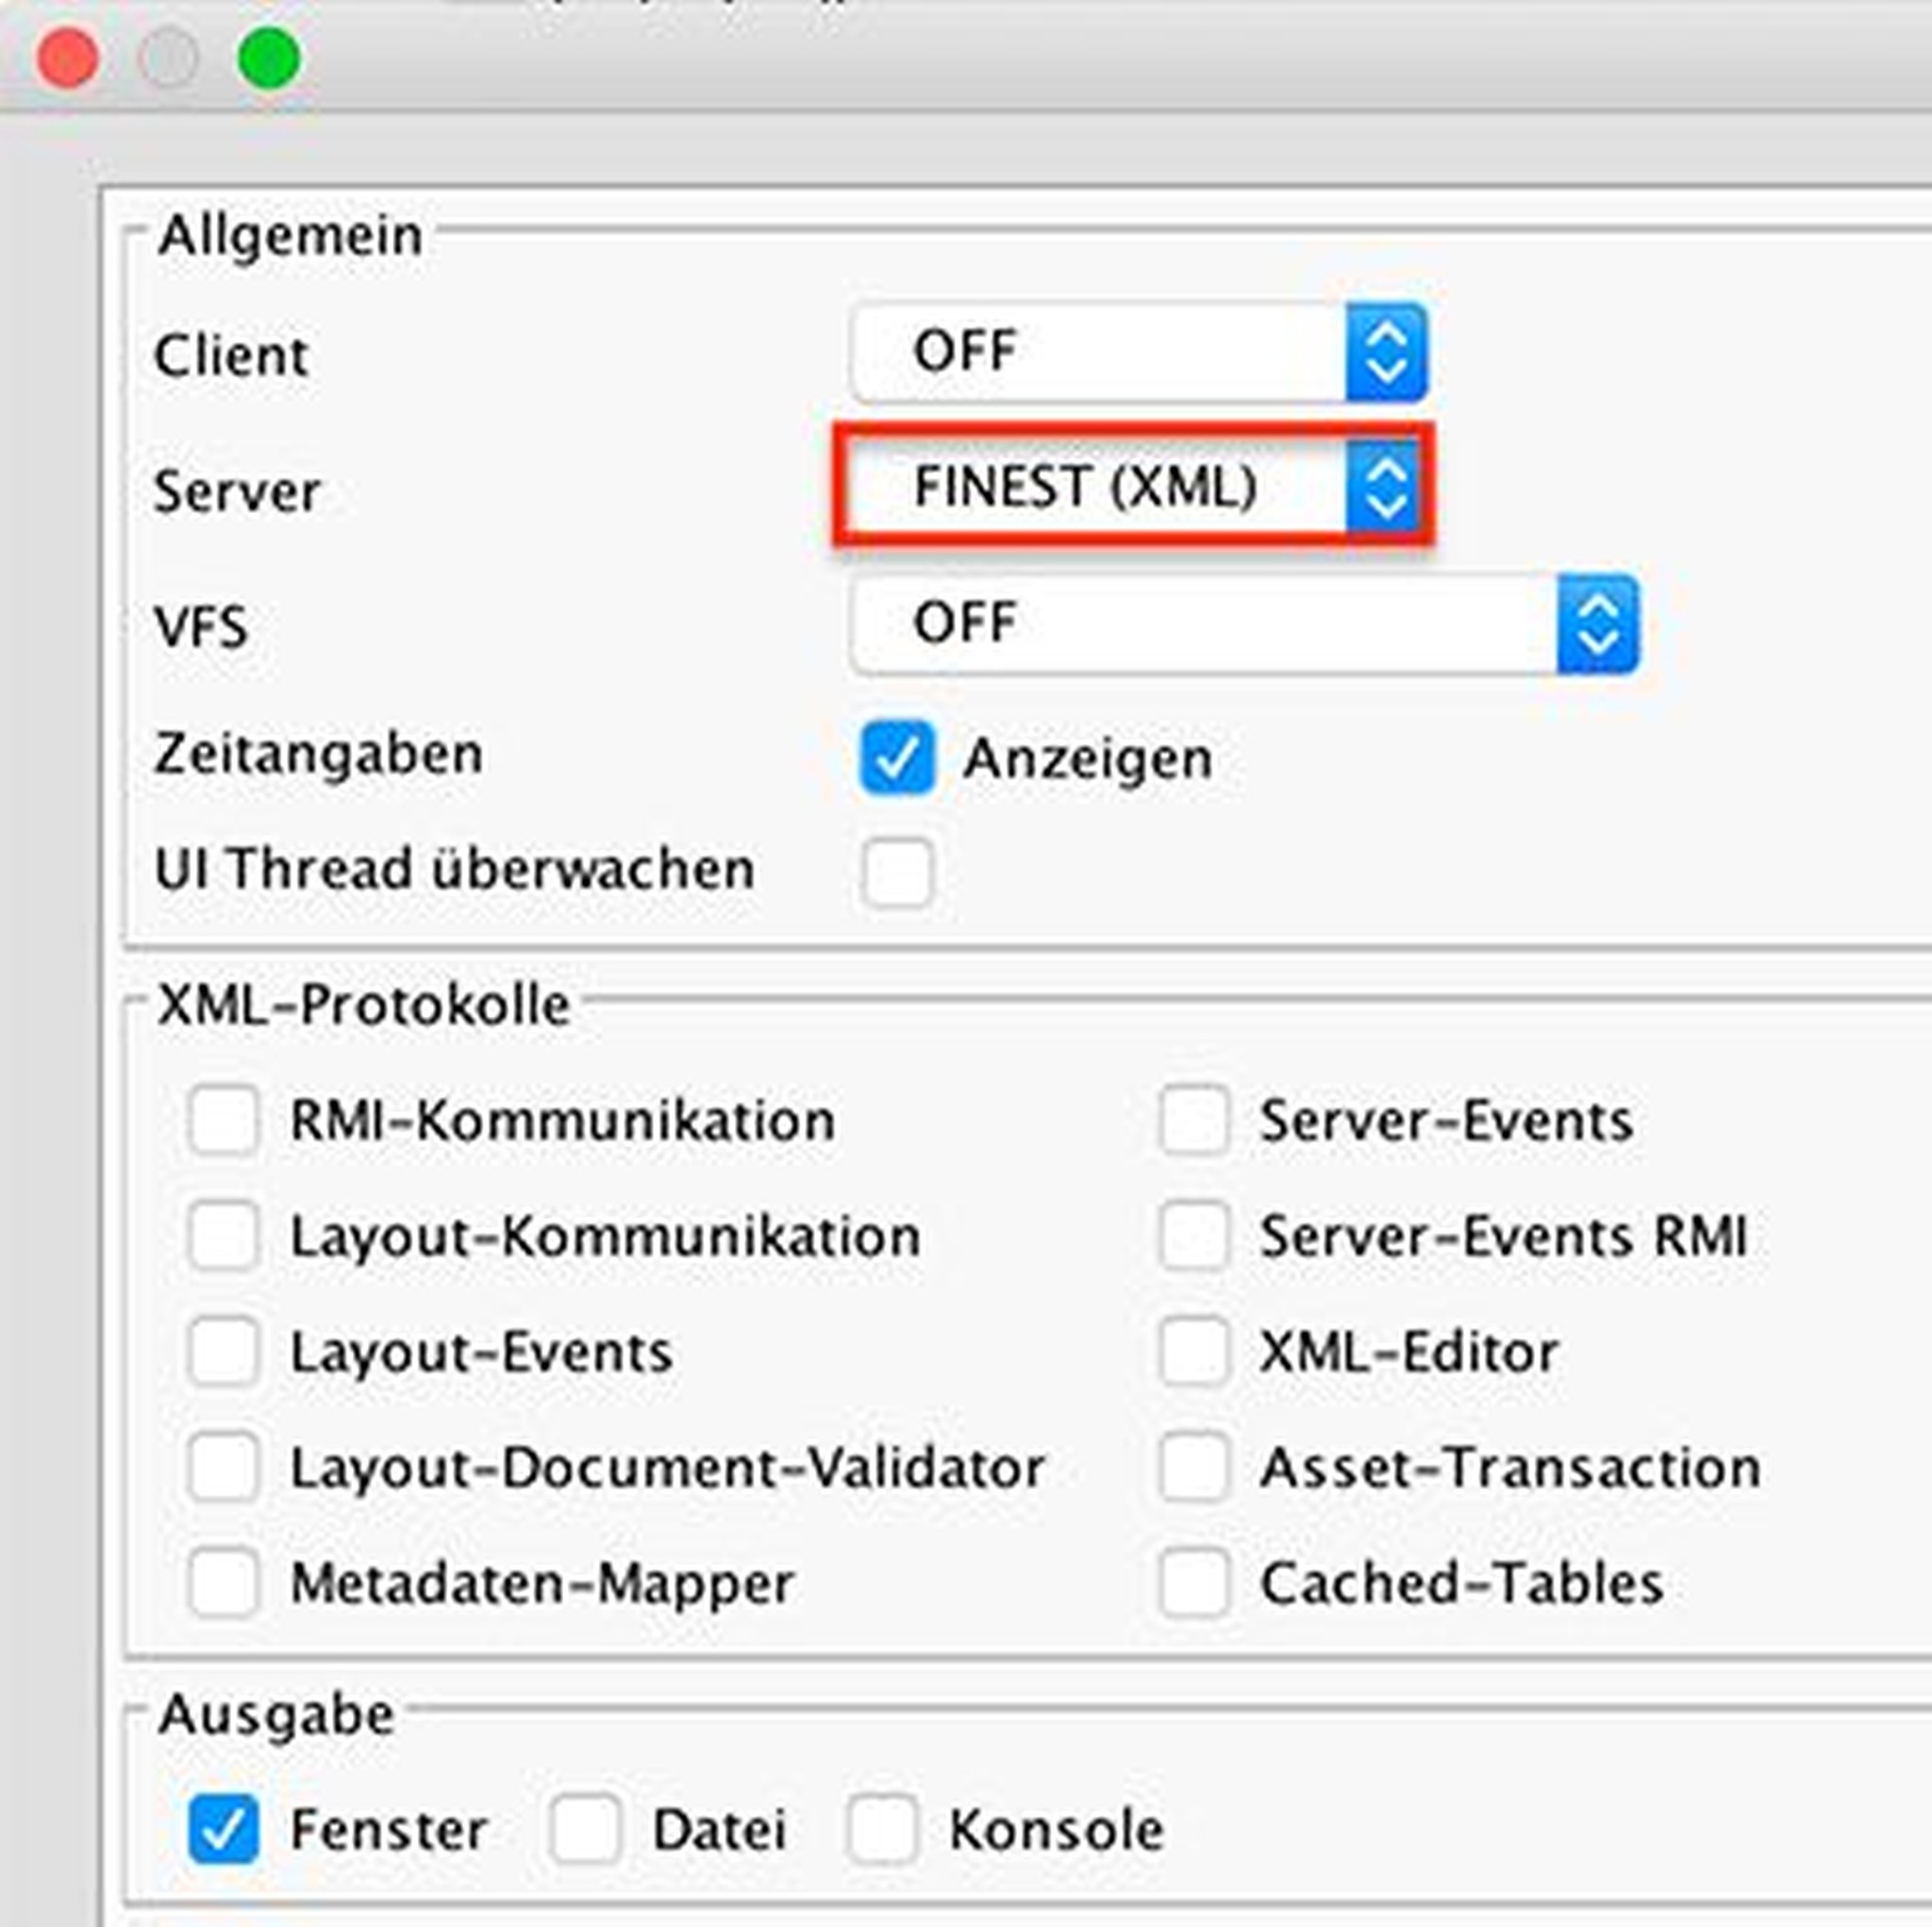
go to the menu "File/Preferences/Logs..." and activate only "General/Server/" to level "FINEST (XML)" and "General/Trace time". Be sure to set the "Output" to "Window"

-
Perform the task you want to measure (e.g. checkout)
-
You will get a new "Logs"-window with three tabs. Save the contents of the "Logs"- and "Server logs"-tab. With this information we can analyse what happened
-
If you want to get the performance data of a further action, delete the current protocols by pressing the trash button
-
Perform the next task you want to measure (e.g. checkin)
-
again save the contents of the "Logs"- and "Server logs"-tab
Please do not forget to deactivate all logging settings in the menu "File/Preferences/Logs..." after your tests in order to avoid server performance issues.
.png)